. 2023 Mar;5(3):516-528.
doi: 10.1038/s42255-023-00753-7. Epub 2023 Feb 23.

Proteogenomic links to human metabolic diseases

Affiliations

Proteogenomic links to human metabolic diseases

Mine Koprulu et al. Nat Metab. 2023 Mar.

Erratum in

Abstract

Studying the plasma proteome as the intermediate layer between the genome and the phenome has the potential to identify new disease processes. Here, we conducted a cis-focused proteogenomic analysis of 2,923 plasma proteins measured in 1,180 individuals using antibody-based assays. We (1) identify 256 unreported protein quantitative trait loci (pQTL); (2) demonstrate shared genetic regulation of 224 cis-pQTLs with 575 specific health outcomes, revealing examples for notable metabolic diseases (such as gastrin-releasing peptide as a potential therapeutic target for type 2 diabetes); (3) improve causal gene assignment at 40% (n = 192) of overlapping risk loci; and (4) observe convergence of phenotypic consequences of cis-pQTLs and rare loss-of-function gene burden for 12 proteins, such as TIMD4 for lipoprotein metabolism. Our findings demonstrate the value of integrating complementary proteomic technologies with genomics even at moderate scale to identify new mediators of metabolic diseases with the potential for therapeutic interventions.


Conflict of interest statement

Competing interests

E.W. is now an employee of AstraZeneca. The remaining authors declare no competing interests.

Figures

Figure 1
Figure 1. Genetic associations of 2,923 proteins measured by the Olink Explore 1536 and Olink Explore Expansion platforms in 1,180 individuals.
Previously unreported and reported pQTLs are represented with a filled and hollow circle, respectively. Only the variants which are genome-wide significant (p-value<5x10⁻⁸) in the joint model are presented. A. Miami plot representing the independent lead cis-pQTLs identified through Bayesian fine-mapping for 914 unique proteins. Shown are p-values from a linear regression model modelling all identified credible set variants for a given protein target jointly. Top: Lead cis-pQTL signals unreported to date. Bottom: Lead cis-pQTL signals which were in linkage disequilibrium (LD; r2>0.5) with a previously reported pQTL. B. Minor allele frequency vs effect size of unreported pQTL signals, coloured by whether the protein has previously been targeted. Unreported pQTL signals for a previously targeted protein are coloured grey and those for a previously untargeted protein are coloured orange. C. Minor allele frequency vs effect size of unreported pQTL signals, coloured by most severe variant consequence prediction. The colour coding represents the most severe Variant Effect Predictor (73) consequence of the lead cis-pQTL, or variants in LD (r2>0.6) within the protein encoding gene. The most severe consequence is coloured red (Ensembl consequence rank = 1) and the least severe consequence is coloured blue (Ensembl consequence rank = 37). D. Minor allele frequency vs effect size of reported pQTL signals, coloured by most severe variant prediction. The colour coding represents the most severe Variant Effect Predictor consequence of the lead cis-pQTL, or variants in LD (r2>0.6) with the lead cis-pQTL within the protein encoding gene. The most severe consequence is coloured red (Ensembl consequence rank = 1) and the least severe consequence is coloured blue (Ensembl consequence rank = 37). Lines are power curves which represent 25% (light grey), 90% (medium grey) and 95% (dark grey) power from the bottom to the top, respectively in our study with 1,180 participants for inverse rank normalized protein level measurements.
Figure 2
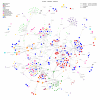
Figure 2. Protein – disease network.
Results from phenome-wide colocalization at protein coding loci (±500kb) are shown. For simplicity, only proteins with at least one binary outcome (i.e., mainly diseases) association are included. Proteins are presented with a square, binary outcomes are presented with large circles, and continuous outcomes are presented with small circles. The colour for the circles present the trait category. Edges between proteins and phenotypes represent strong evidence for a shared genetic signal (PP>80% and LD between regional sentinel variants >0.8). Effect directions are indicated by the line type (solid = higher protein abundance, increased risk, dashed = higher protein abundance, reduced risk) and derived based on the lead cis-pQTL at the corresponding locus. The full list of colocalization results can be found in Supplementary Table 7 and results can be viewed in full resolution in Cytoscape session provided in Supplementary Data 1. Abbreviations: GIT, gastrointestinal tract.
Figure 3
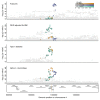
Figure 3. Stacked regional association plots for the multi-trait colocalization.
Linear and logistic regression models were used to obtain summary statistics presented in this figure. A. Stacked regional association plots for the multi-trait colocalization of the GRP cis-pQTL with gynoid fat, android fat, total body fat, body mass index and type 2 diabetes. The top candidate SNP highlighted by multi-trait colocalization (rs7243357) and lead cis-pQTL for GRP (rs1517035) are in strong LD (r2=0.8). Gynoid fat, android fat and total body fat phenotypes are based on UK Biobank and were analysed in-house using BOLT-LMM (80). B. Stacked regional association plot the multi-trait colocalization of the FGFR4 cis-pQTL with type 2 diabetes in East Asian populations. Red colouring represents a positive effect direction in reference to the protein increasing allele for GRP whereas blue represent an inverse association. The hue of the colour represents the strength of r2 representing the LD structure, as indicated on the legend. European Type 2 diabetes summary statistics were obtained from dbGAP Million Veteran Program (MVP) European subset (ncases= 148,726, ncontrols= 965,732) (25). East Asian Type 2 diabetes summary statistics were obtained from Mahajan et al (2022) (ncases= 56,268, ncontrols= 227,155) (24). The body mass index summary statistics were obtained from Pulit et al. (2019) (n=806,834) (81).
Figure 4
Figure 4. Candidate causal gene assignment at reported GWAS loci using pQTLs. The marked genetic locations on the human karyotypes (chromosomes 1-22) only present the existing GWAS risk loci which overlapped with pQTL loci (n=480).
The locus is coloured orange if the pQTL provides a novel candidate causal gene assignment for one or more traits, light blue if it refines a candidate causal gene from a longer list of reported or closest genes, and dark blue if it confirms the candidate causal gene assignment provided by the GWAS.
Figure 5
Figure 5. Allelic heterogeneity at protein coding loci translates into distinct phenotypic consequences at IDUA.
Regional associations plots centered around IDUA (±400kb) for plasma alpha-L-iduronidase levels, type 1 diabetes (50), waist-to-hip ratio (WHR) adjusted for body mass index (BMI) (48), and risk of fractures (46). Shown are association statistics (p-values) from genome-wide association analysis, obtained from linear and logistic regression models. Single genetic variants were coloured based on LD with three distinct cis-pQTLs (rs3796522 – orange; rs115134980 – purple; rs11724804 – green). Lead cis-pQTLs are highlighted by hollow diamonds.
Figure 6
Figure 6. Phenotypic convergence of rare variant burden and common cis-pQTLs for protein coding genes and TIMD4 as an example.
A. Venn diagram showing the number of genes with a significant rare variant gene burden association (p<1E-06) with at least one trait (53) in blue and the number of genes with a significant pQTL colocalization (PP>80%) with at least one trait in orange. All 2,939 unique genes covered by Olink Explore 1536 and Explore Expansion assays were investigated. B. Forest plot comparing the effect size estimates between TIMD4 cis-pQTL (rs58198139) and rare TIMD4 loss of function (LoF) gene-burden results (variant group: missense and loss of function variants with a minor allele frequency < 1%) for low density lipoprotein cholesterol, total cholesterol and triglyceride levels. Rare TIMD4 loss of function (LoF) gene-burden (n=454,787) results are shown in blue and TIMD4 cis-pQTL associations (n=1,180) are shown in orange. C. Stacked regional plot of the multi-trait colocalization of TIMD4 cis-pQTL with lymphocyte count, low density lipoprotein cholesterol, and triglycerides. Red colouring represents a positive effect direction with protein increasing allele with TIMD4 whereas blue represent an inverse association. The hue of the colour represents the strength of r2 representing the LD structure, as indicated on the legend. Linear regression models were used to obtain summary statistics presented in this figure.

Comment in

References

    1. Buniello A, MacArthur JAL, Cerezo M, Harris LW, Hayhurst J, Malangone C, et al. The NHGRI-EBI GWAS Catalog of published genome-wide association studies, targeted arrays and summary statistics 2019. Nucleic Acids Res. 2019;47(D1):D1005–D12. - PMC - PubMed
    1. Barbeira AN, Bonazzola R, Gamazon ER, Liang Y, Park Y, Kim-Hellmuth S, et al. Exploiting the GTEx resources to decipher the mechanisms at GWAS loci. Genome Biol. 2021;22(1):49. - PMC - PubMed
    1. Moore JE, Purcaro MJ, Pratt HE, Epstein CB, Shoresh N, Adrian J, et al. Expanded encyclopaedias of DNA elements in the human and mouse genomes. Nature. 2020;583(7818):699–710. - PMC - PubMed
    1. Abell NS, DeGorter MK, Gloudemans MJ, Greenwald E, Smith KS, He Z, et al. Multiple causal variants underlie genetic associations in humans. Science. 2022;375(6586):1247–54. - PMC - PubMed
    1. Suhre K, Arnold M, Bhagwat AM, Cotton RJ, Engelke R, Raffler J, et al. Connecting genetic risk to disease end points through the human blood plasma proteome. Nat Commun. 2017;8:14357. - PMC - PubMed

Publication types