. 2023 Feb 7:14:1070359.
doi: 10.3389/fpls.2023.1070359. eCollection 2023.

Oxygenic photosynthetic responses of cyanobacteria exposed under an M-dwarf starlight simulator: Implications for exoplanet's habitability

Affiliations

Oxygenic photosynthetic responses of cyanobacteria exposed under an M-dwarf starlight simulator: Implications for exoplanet's habitability

Mariano Battistuzzi et al. Front Plant Sci. .

Abstract

Introduction: The search for life on distant exoplanets is expected to rely on atmospheric biosignatures detection, such as oxygen of biological origin. However, it is not demonstrated how much oxygenic photosynthesis, which on Earth depends on visible light, could work under spectral conditions simulating exoplanets orbiting the Habitable Zone of M-dwarf stars, which have low light emission in the visible and high light emission in the far-red/near-infrared. By utilizing cyanobacteria, the first organisms to evolve oxygenic photosynthesis on our planet, and a starlight simulator capable of accurately reproducing the emission spectrum of an M-dwarf in the range 350-900 nm, we could answer this question.

Methods: We performed experiments with the cyanobacterium Chlorogloeopsis fritschii PCC6912, capable of Far-Red Light Photoacclimation (FaRLiP), which allows the strain to harvest far-red in addition to visible light for photosynthesis, and Synechocystis sp. PCC6803, a species unable to perform this photoacclimation, comparing their responses when exposed to three simulated light spectra: M-dwarf, solar and far-red. We analysed growth and photosynthetic acclimation features in terms of pigment composition and photosystems organization. Finally, we determined the oxygen production of the strains directly exposed to the different spectra.

Results: Both cyanobacteria were shown to grow and photosynthesize similarly under M-dwarf and solar light conditions: Synechocystis sp. by utilizing the few photons in the visible, C. fritschii by harvesting both visible and far-red light, activating the FaRLiP response.

Discussion: Our results experimentally show that an M-dwarf light spectrum could support a biological oxygen production similar to that in solar light at the tested light intensities, suggesting the possibility to discover such atmospheric biosignatures on those exoplanets if other boundary conditions are met.

Keywords: M-dwarf spectrum; biosignatures; cyanobacteria; laboratory simulations; light acclimation; oxygenic photosynthesis.


Conflict of interest statement

The authors declare that the research was conducted in the absence of any commercial or financial relationships that could be construed as a potential conflict of interest.

Figures

Figure 1
Figure 1
The experimental setup utilized for the experiments. (A) Temperature-controlled cabinet. Here is shown the cabinet with the Star Light Simulator (SLS) mounted on top and the Atmosphere Simulator Chamber (ASC) positioned in the flatbed under it; the major elements of the setup are highlighted with numbers: 1. ASC; 2. Light source (here is the SLS); 3. Control software for the ASC; 4,5. Temperature control elements of the cabinet (heater, fan, temperature probe); 6. Main temperature control of the cabinet. (B) Cutaway diagram of the ASC; 7. CO2 and O2 sensors housings; 8. Petri dish with cyanobacteria on it; (C) close-up of the ASC.
Figure 2
Figure 2
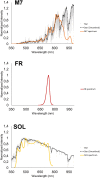
The light spectra utilized in the study. From top to bottom: M-dwarf simulated light spectrum (M7); 730 nm monochromatic far-red light spectrum (FR); Solar simulated light spectrum (SOL). All spectra are normalized at the highest peak of emission of the simulated spectrum; For M-dwarf and Solar spectra, the emission spectrum of the star taken as reference (an M7 and a G2 respectively) and its smoothed version are shown in grey and black respectively; the simulated spectrum, designed based on the smoothed spectrum, is shown in bold colour.
Figure 3
Figure 3
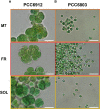
Bright-field optical microscopy of PCC6912 (A) and PCC6803 (B) samples after 21 days of exposure to the selected light spectra at higher magnification. Images were obtained through an optical microscope (Leica DM6B, Leica, Wetzlar, Germany), utilizing white lights, and maintaining the acquisition settings for each sample. Orange: M7; red: FR; yellow: SOL. Scale bars: 10 µm.
Figure 4
Figure 4
21 days growth curves of PCC6912 (A) and PCC6803 (B) under M7, FR and SOL light spectra. Dry weight and optical density of PCC6912 and PCC6803 cultures at 21 days starting from OD = 0,2 and DW (g/L) = 0,26 (PCC6912), DW (g/L) = 0,11 (PCC6803) (C). Data are presented as averages ± standard deviation of four biological replicates. Different letters highlight significant differences between light conditions within the same strain. (one-way ANOVA, p-value< 0,001). M7, M-dwarf light; FR, Far-red light; SOL, Solar light.
Figure 5
Figure 5
Pictures of PCC6912 (A) and PCC6803 (B) cultures after 21 days of cultivation under the different light spectra. Orange: M7; red: FR; yellow: SOL.
Figure 6
Figure 6
In vivo absorption spectra of PCC6912 (A) and PCC6803 (B) after 21 days. Where present, absorption from pigments involved in the FaRLiP response is highlighted with a black arrow. M7, M-dwarf light; FR, Far-red light; SOL, Solar light; Chl a, Chlorophyll a; PC, Phycocyanin; Chl f, Chlorophyll f; Chl d, Chlorophyll d; FR-AP, far-red induced allophycocyanin. Spectra are normalized at 680 nm to highlight FaRLiP.
Figure 7
Figure 7
HPLC Chromatogram at 705 nm of PCC6912 (A) and PCC6803 (B) samples after 21 days of exposure. M7, M-dwarf light; FR: Far-red light; SOL, Solar light; Chl a, Chlorophyll a; Chl f, Chlorophyll f; Chl d, Chlorophyll d.
Figure 8
Figure 8
77 K fluorescence emission spectra of PCC6912 (A) and PCC6803 (B) samples after 3 days of exposure. Excitation light was set at 440 nm. Spectra are normalized to the maximum peak of fluorescence of each sample. WL-PSI, WL-PSII and FR-PSI respectively designate emission fluorescence of white light photosystem I, white light photosystem II and far-red light photosystem I; M7, M-dwarf light; FR, Far-red light; SOL, Solar light.
Figure 9
Figure 9
77 K fluorescence emission spectra of PCC6912 (A) and PCC6803 (B) samples after 21 days of exposure. Excitation light was set at 440 nm. Spectra are normalized to the maximum peak of fluorescence of each sample. WL-PSI, WL-PSII and FRL-PSI respectively designate emission fluorescence of white light photosystem I, white light photosystem II and far-red light photosystem I; M7, M-dwarf light; FR, Far-red light; SOL, Solar light.
Figure 10
Figure 10
O2 traces of PCC6912 (A) and PCC6803 (B) strains acclimated for 21 days to the different light spectra. T0 was set at 3.600 s to exclude the initial gas equilibration period inside the ASC.

References

    1. Adams F. C., Laughlin G. (1997). A dying universe: The long-term fate and evolution of astrophysical objects. Rev. Modern Phys. 69 (2), 337. doi: 10.1103/revmodphys.69.337 - DOI
    1. Anglada-Escudé G., Amado P. J., Barnes J., Berdiñas Z. M., Butler R. P., Coleman G. A. L., et al. . (2016). A terrestrial planet candidate in a temperate orbit around proxima centauri. Nature 536 (7617), 437–440. doi: 10.1038/nature19106 - DOI - PubMed
    1. Antonaru L. A., Cardona T, Larkum A. W. D., Nürnberg D. J. (2020). Global distribution of a chlorophyll f cyanobacterial marker. ISME J. 14 (9), 2275–2287. doi: 10.1038/s41396-020-0670-y - DOI - PMC - PubMed
    1. Barnes R. (2017). Tidal locking of habitable exoplanets. Celestial Mechanics Dynamical Astronomy 129 (4), 509–536. doi: 10.1007/s10569-017-9783-7 - DOI
    1. Battistuzzi M., Cocola L., Salasnich B., Erculiani M. S, Alei E., Morosinotto T., et al. . (2020). A new remote sensing-based system for the monitoring and analysis of growth and gas exchange rates of photosynthetic microorganisms under simulated non-terrestrial conditions. Front. Plant Sci. 11 (March). doi: 10.3389/fpls.2020.00182 - DOI - PMC - PubMed