. 2022 Nov 17;2(11):1449-1461.
doi: 10.1158/2767-9764.CRC-22-0298.

Boosting of Waned Humoral and Cellular Responses to SARS-CoV-2 Variants of Concern Among Patients with Cancer

Affiliations

Boosting of Waned Humoral and Cellular Responses to SARS-CoV-2 Variants of Concern Among Patients with Cancer

Duncan R McKenzie et al. Cancer Res Commun. .

Abstract

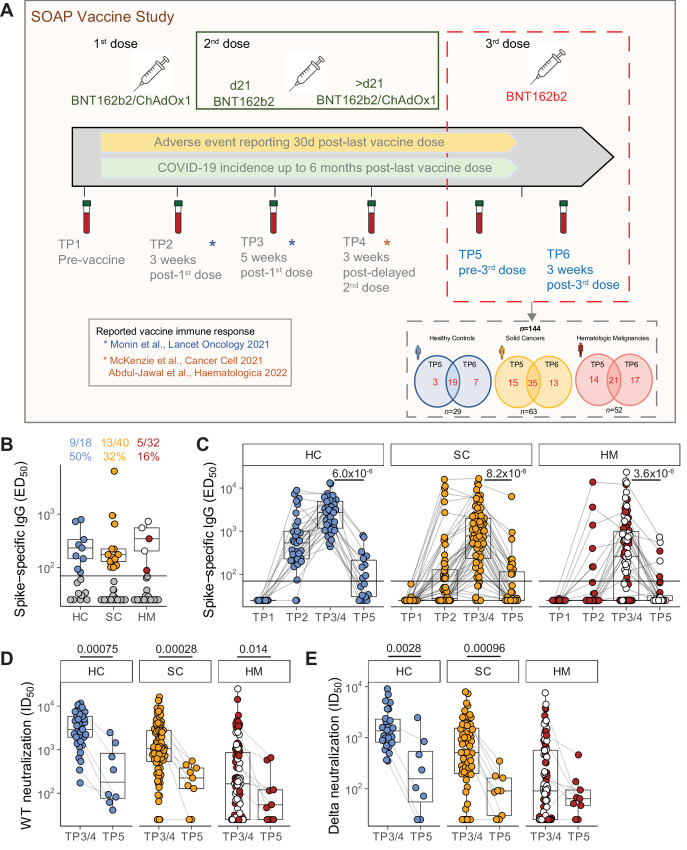
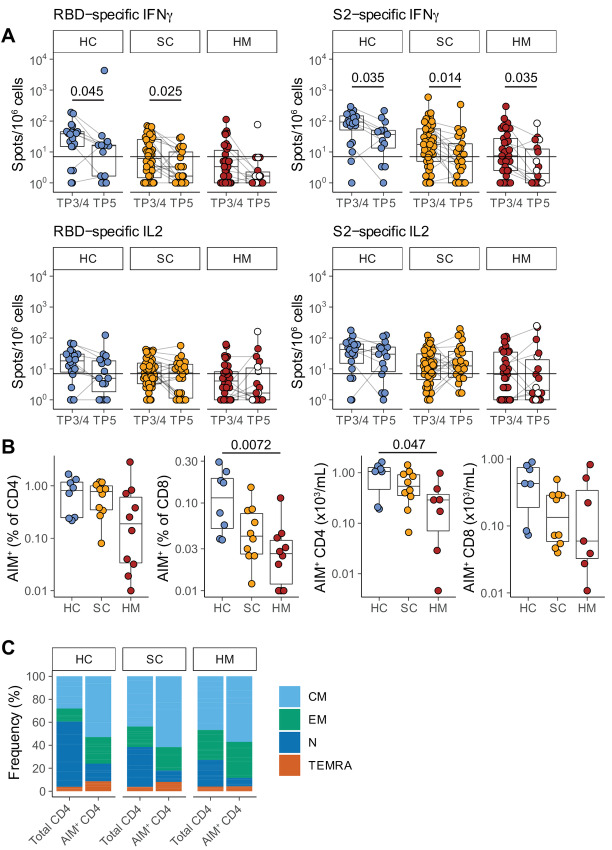
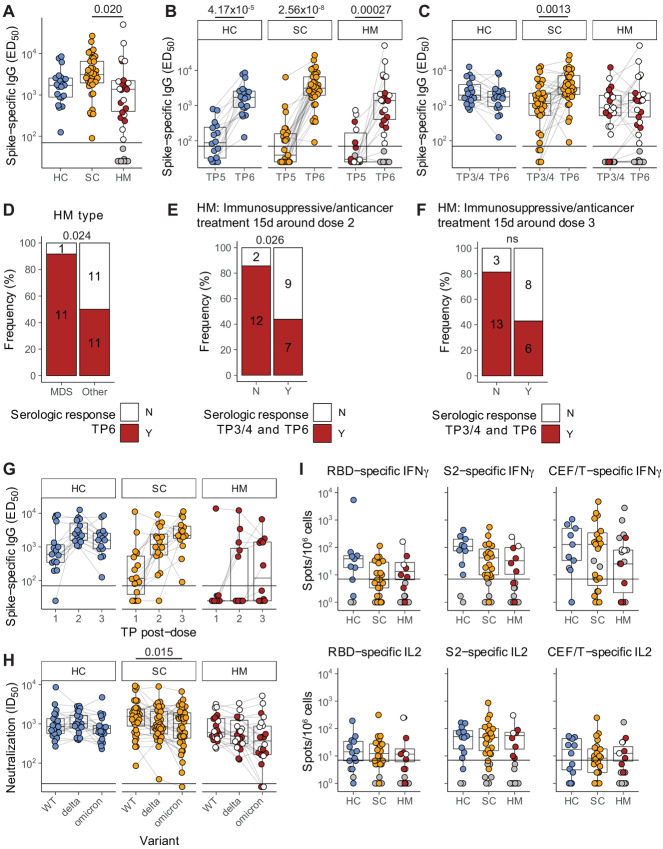
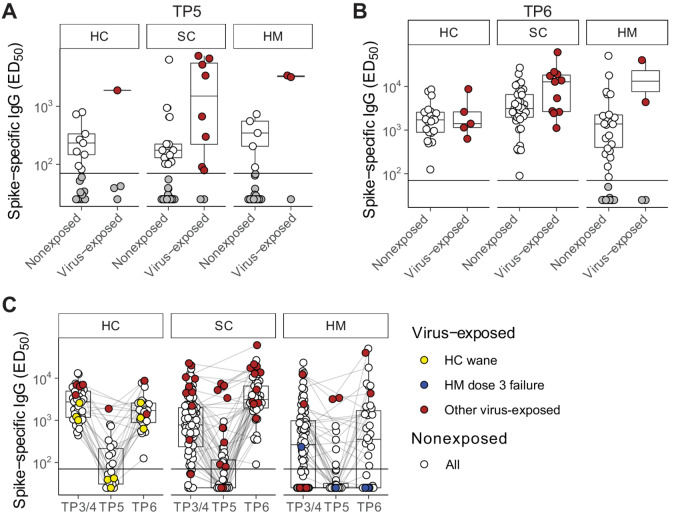
This study offers longitudinal insight into the impact of three SARS-CoV-2 vaccinations on humoral and cellular immunity in patients with solid cancers, patients with hematologic malignancies, and persons without cancer. For all cohorts, virus-neutralizing immunity was significantly depleted over a period of up to 9 months following the second vaccine dose, the one striking exception being IL2 production by SARS-CoV-2 antigen-specific T cells. Immunity was restored by the third vaccine dose, except in a substantial number of patients with hematologic malignancy, for whom both cancer type and treatment schedule were associated with nonresponse. Thus, whereas most patients with myelodysplastic syndrome were conspicuously good responders, some patients with other hematologic malignancies receiving cancer therapies within 2 weeks of vaccination showed no seroconversion despite three vaccine doses. Moreover, SARS-CoV-2 exposure during the course of the study neither prevented immunity waning, even in healthy controls, nor guaranteed vaccine responsiveness. These data offer real-world human immunologic insights that can inform health policy for patients with cancer.


Conflict of interest statement

Authors’ Disclosures P. Patten reports grants from Gilead, Roche; personal fees from Janssen, AstraZeneca, Abbvie, Beigene, and Novartis outside the submitted work. A.C. Hayday is co-founder, board member, and equity holder in ImmunoQure AG. This company is interested in antibodies but has no infectious disease or vaccine programs so cannot objectively be in conflict of interest with the work pursued in the study submitted to you; co-founder, board member, and equity holder in Gamma Delta Therapeutics. This company which no longer exists, was interested in gamma delta T cell which are an immunologic components, but the company has no infectious disease or vaccine programs so cannot objectively be in conflict of interest with the work pursued in the study submitted to you; co-founder, board member, and equity holder in Adaptate Biotherapeutics. This company, which no longer exists, was interested in gamma delta T cells which are an immunologic components, but the company has no infectious disease or vaccine programs so cannot objectively be in conflict of interest with the work pursued in the study submitted to you. A.C. Hayday receives research funding from Marengo Inc but this is a T-cell company with no vaccine program. A.C. Hayday receives research funding from Takeda Inc but this is funding solely relates to the use of gamma delta T cells for cancer immunotherapy. No disclosures were reported by the other authors.

Figures

FIGURE 1
FIGURE 1
Waning serologic responses to SARS-CoV-2 vaccination. A, Study design. Venn diagrams demonstrated the number of patients recruited for TP5 and TP6 analysis, as well as patients with both timepoints available for analysis. B, Plasma spike-specific IgG titres at TP5. Numbers represent the frequency of individuals with titres above the seropositivity threshold (>70 EC50 dilution). Sample comparisons tested by a Kruskal–Wallis test with Dunn multiple comparisons test and corrected by the Holm method (ns). Boxplots and statistics summarize responder values only (HC n = 9/18, SC n = 13/40, HM n = 5/32). Gray: nonresponders; blue: HC, orange: SC, red: non-MDS HM, white: MDS HM. C, Spike-specific IgG titres in plasma samples at TP1–5. Patient-matched samples are linked by lines. Matched samples at TP3/4 and TP5 (HC n = 15, SC n = 37, HM n = 31) were compared by a Wilcoxon signed-rank test and P values corrected by the Benjamini–Hochberg method. White: MDS. Plasma neutralization titres against wildtype (D) and B.1.617.2 delta (E) SARS-CoV-2 variants at TP3/4 and TP5. Sample comparisons tested by a partially matched Wilcoxon test and P values corrected by the Benjamini–Hochberg method (WT TP3/4: HC n = 37, SC n = 83, HM n = 93; delta TP3/4 n = 26, SC n = 64, HM n = 88; WT/delta TP5 n = 8, SC n = 9, HM n = 9). White: MDS. Boxplots represent the median, Q1 and Q3. Horizontal lines represent response thresholds. ED50: plasma dilution at 50% binding; HC: healthy control; HM: hematologic malignancy; ID50: inhibitory dilution at which 50% of virus particles are neutralized; MDS: myelodysplastic syndrome; ns: nonsignificant; SC: solid cancer; TP: timepoint.
FIGURE 2
FIGURE 2
T-cell responses prior to SARS-CoV-2 vaccination dose 3. A, Functional T-cell responses were measured using fluorospot assays to measure IFNγ and IL2 release by T cells stimulated with one of the following peptide mixes presented on autologous antigen-presenting cells: SARS-CoV-2 spike 2 peptides (“S2”); SARS-CoV-2 RBD peptides (“RBD”); and control peptides derived from CEFT at TP3/4 and TP5. Individuals were classified as responders if they scored >7 cytokine secreting cells/106 PBMC for IFNγ and/or for IL2 in response to RBD and/or S2 peptide pools. Sample comparisons tested by a partially matched Wilcoxon test and P values corrected by the Benjamini–Hochberg method (TP3/4: HC n = 20, SC n = 48, HM n = 37; TP5 HC n = 14, SC n = 26, HM n = 18; n is variable due to technical dropouts). White: MDS. B, Frequency (left) and number (right) of spike-specific AIM+ CD4 and CD8 T cells at TP5, as defined by AIM+ cell frequency following stimulation with spike peptide pools minus control stimulation. Sample comparisons tested by a Kruskal–Wallis test with Dunn multiple comparisons test and corrected by the Holm method (HC n = 8, SC n = 10, HM n = 10; n is variable due to cell count dropouts). C, Frequency of naïve and memory subsets among total and AIM+ CD4 T cells following restimulation with spike peptide pools. Boxplots represent the median, Q1 and Q3. Horizontal lines represent response thresholds. AIM: activation-induced markers; HC: healthy control; HM: hematologic malignancy; MDS: myelodysplastic syndrome; ns: nonsignificant; SC: solid cancer; TP: timepoint.
FIGURE 3
FIGURE 3
Boosted serologic responses and persistent T-cell responses following SARS-CoV-2 vaccination dose 3. A, Plasma spike-specific IgG titres at TP6. Numbers represent the frequency of individuals with titres above the seropositivity threshold. Sample comparisons tested by a Kruskal–Wallis test with Dunn multiple comparisons test and corrected by the Holm method. Boxplots and statistics summarize responder values only (HC n = 21/21, SC n = 37/37, HM n = 22/34). Gray: nonresponders; white: MDS. Spike-specific IgG titres in plasma samples at TP5 to TP6 (B) and TP3/4 to TP6 (C). Patient-matched samples are linked by lines. Matched samples at both TP were compared by a Wilcoxon signed-rank test and P values corrected by the Benjamini–Hochberg method. Boxplots and statistics summarize only patients who were serologic responders at both TP in (HC n = 15/15, SC n = 27/27, HM n = 10/18; B) and (HC n = 18/18, SC n = 35/35, HM n = 21/32; C). Gray: serologic nonresponders at both TP; white: MDS. D, Serologic response at TP6 comparing MDS and other patients with HM. Contingency analysis performed by a Fisher exact test (MDS n = 12, other n = 22); numbers on graph indicate patient counts. Serologic responses at TP6 comparing overall serologic response of patients with HM with matched TP3/4 and TP6 samples receiving immunosuppressive and/or antitumor treatment within 15 days either side of dose 2 (E) or dose 3 (F). Contingency analysis performed by a Fisher exact test in (untreated n = 14, treated n = 16; E) and (untreated n = 16, treated n = 14; F); numbers on graphs indicate patient counts. G, Longitudinal analysis of spike-specific IgG titres after each dose (TP2, TP3/4, and TP6) in patients with matched datasets (HC n = 15, SC n = 16, HM n = 12). H, Plasma neutralization titres against wildtype, B.1.617.2 (delta) and BA.1 (omicron) SARS-CoV-2 variants in serologic responders at TP6 (matched patient samples are linked). Sample comparisons tested by a Friedman test with Wilcoxon signed-rank post-tests and P values corrected by the Bonferroni method (HC n = 21, SC n = 36, HM n = 22). White: MDS. I, T-cell IFNγ and IL2 responses to SARS-CoV-2 RBD and S2 peptide pools at TP6. Only patients who were overall T-cell responders are represented by boxplots and compared by a Kruskal–Wallis test with Dunn multiple comparisons test and corrected by the Holm method (HC n = 12/14, SC n = 20/26, HM n = 8/19), all ns. Gray: T-cell nonresponders; white: MDS. Boxplots represent the median, Q1 and Q3. Horizontal lines represent response thresholds. ED50: plasma dilution at 50% binding; HC: healthy control; HM: hematologic malignancy; MDS: myelodysplastic syndrome; ns: nonsignificant; SC: solid cancer; TP: timepoint.
FIGURE 4
FIGURE 4
Serologic wane and boost around SARS-CoV-2 vaccine dose 3 in naturally exposed individuals. Plasma spike-specific IgG titres in unexposed and previously SARS-CoV-2 exposed patients at TP5 (A) and TP6 (B). Numbers represent the frequency of individuals with titres above the seropositivity threshold. Sample comparisons tested by Wilcoxon rank-sum test and P values corrected by the Benjamini–Hochberg method, all ns. Boxplots and statistics summarize responder values only in (HC unexposed n = 9/18, exposed n = 1/4; SC unexposed n = 13/40, exposed n = 8/10; HM unexposed n = 5/32, exposed n = 2/3; A) and (HC unexposed n = 21/21, exposed n = 5/5; SC unexposed n = 37/37, exposed n = 11/11; HM unexposed n = 22/34, exposed n = 2/4; B). C, Longitudinal analysis of spike-specific IgG titres in all patients at TP3/4, TP5, and TP6 (HC unexposed n = 41, exposed n = 8; SC unexposed n = 86, exposed n = 18; HM unexposed n = 95, exposed n = 8 unique patients). Matched patient samples are linked. White: unexposed; red: naturally exposed; yellow: examples of naturally exposed HC (n = 3) who exhibited a wane/boost effect; blue: examples of naturally exposed HM (n = 2) who failed to respond to dose 3. Boxplots represent the median, Q1 and Q3. Horizontal lines represent response thresholds. ED50: plasma dilution at 50% binding; HC: healthy control; HM: hamatologic malignancy; MDS: myelodysplastic syndrome; ns: nonsignificant; SC: solid cancer; TP: timepoint.

References

    1. Monin L, Laing AG, Muñoz-Ruiz M, McKenzie DR, Del Molino Del Barrio I, Alaguthurai T, et al. . Safety and immunogenicity of one versus two doses of the COVID-19 vaccine BNT162b2 for patients with cancer: interim analysis of a prospective observational study. Lancet Oncol 2021;22:765–78. - PMC - PubMed
    1. McKenzie DR, Muñoz-Ruiz M, Monin L, Alaguthurai T, Lechmere T, Abdul-Jawad S, et al. . Humoral and cellular immunity to delayed second dose of SARS-CoV-2 BNT162b2 mRNA vaccination in patients with cancer. Cancer Cell 2021;39:1445–7 - PMC - PubMed
    1. Lee ARYB, Wong SY, Chai LYA, Lee SC, Lee MX, Muthiah MD, et al. . Efficacy of covid-19 vaccines in immunocompromised patients: systematic review and meta-analysis. BMJ 2022;376:e068632. - PMC - PubMed
    1. Immunisation TJCoVa; Green book chapter 14a. Available from: https://assets.publishing.service.gov.uk/government/uploads/system/uploa....
    1. Fendler A, Shepherd STC, Au L, Wu M, Harvey R, Schmitt AM, et al. . Omicron neutralising antibodies after third COVID-19 vaccine dose in patients with cancer. Lancet 2022;399:905–7. - PMC - PubMed

Publication types

Supplementary concepts