

Transcriptome, proteome, and protein synthesis within the intracellular cytomatrix
- PMID: 36824274
- PMCID: PMC9941065
- DOI: 10.1016/j.isci.2023.105965
Transcriptome, proteome, and protein synthesis within the intracellular cytomatrix
Abstract
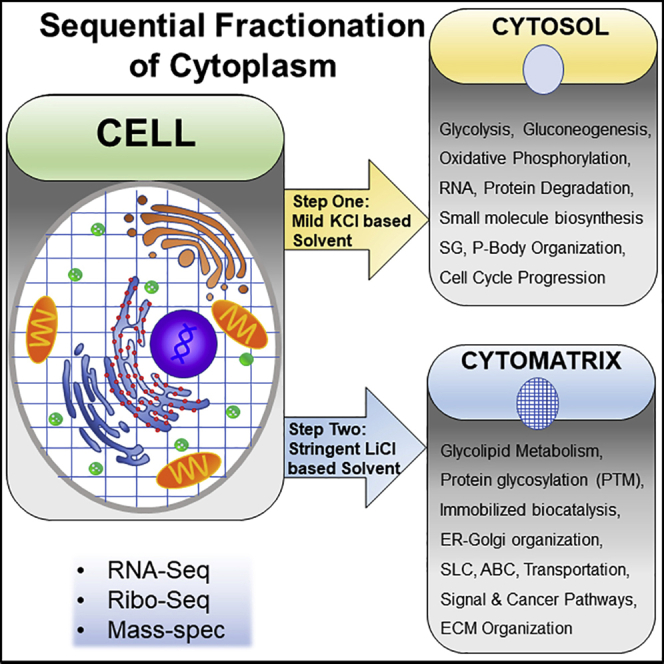
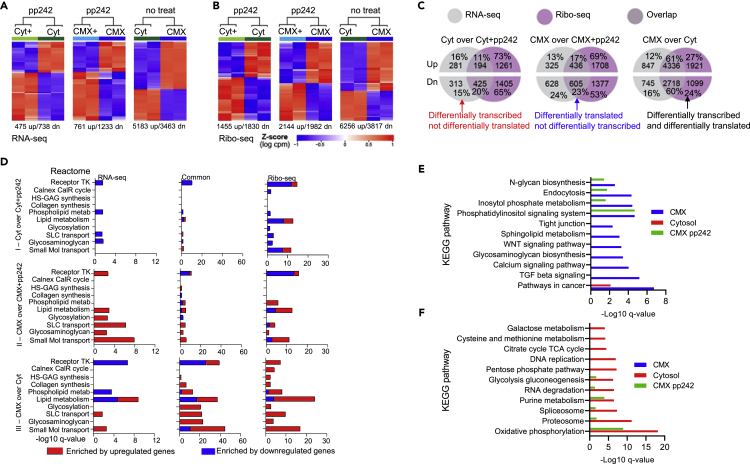
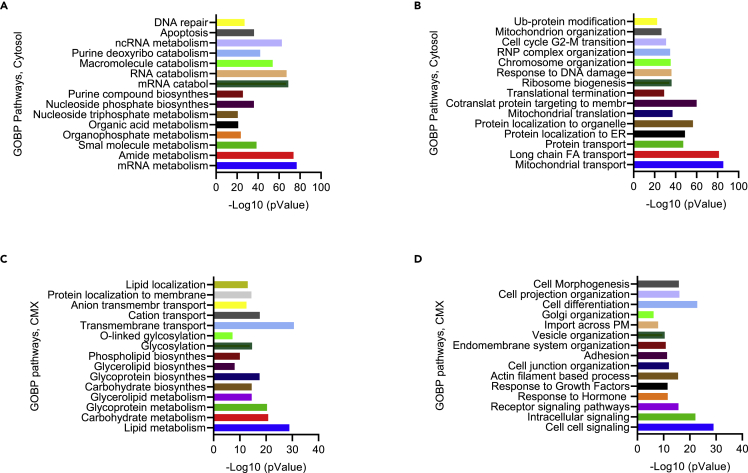
Despite the knowledge that protein translation and various metabolic reactions that create and sustain cellular life occur in the cytoplasm, the structural organization within the cytoplasm remains unclear. Recent models indicate that cytoplasm contains viscous fluid and elastic solid phases. We separated these viscous fluid and solid elastic compartments, which we call the cytosol and cytomatrix, respectively. The distinctive composition of the cytomatrix included structural proteins, ribosomes, and metabolome enzymes. High-throughput analysis revealed unique biosynthetic pathways within the cytomatrix. Enrichment of biosynthetic pathways in the cytomatrix indicated the presence of immobilized biocatalysis. Enzymatic immobilization and segregation can surmount spatial impediments, and the local pathway segregation may form cytoplasmic organelles. Protein translation was reprogrammed within the cytomatrix under the restriction of protein synthesis by drug treatment. The cytosol and cytomatrix are an elaborately interconnected network that promotes operational flexibility in healthy cells and the survival of malignant cells.
Keywords: Cell biology; Molecular biology; Proteomics; Transcriptomics.
© 2023 The Author(s).
Conflict of interest statement
The authors declare no competing interests. Patent No: US 11,428,693 B2; Data of Patent: Aug. 30, 2022 “Method of high throughput screening of chemical compounds suppressing nucleolar hypertrophy” Applicant: Baylor College of Medicine, Houston, TX (US) Inventor: Tattym E. Shaiken, Houston, TX (US) Patent materials were incorporated, in part, in the Result section “Assessment of protein synthesis in the cytosol and the cytomatrix”
Figures
Similar articles
-
Influence of cytomatrix proteins on water and on ions in cells.Scanning Microsc. 1988 Mar;2(1):275-88. Scanning Microsc. 1988. PMID: 3285455 Review.
-
Intracellular water and the cytomatrix: some methods of study and current views.J Cell Biol. 1984 Jul;99(1 Pt 2):167s-171s. doi: 10.1083/jcb.99.1.167s. J Cell Biol. 1984. PMID: 6378919 Free PMC article. Review.
-
Quantitative Proteomics Links the LRRC59 Interactome to mRNA Translation on the ER Membrane.Mol Cell Proteomics. 2020 Nov;19(11):1826-1849. doi: 10.1074/mcp.RA120.002228. Epub 2020 Aug 11. Mol Cell Proteomics. 2020. PMID: 32788342 Free PMC article.
-
The cytomatrix as a cooperative system of macromolecular and water networks.Curr Top Dev Biol. 2006;75:171-223. doi: 10.1016/S0070-2153(06)75006-2. Curr Top Dev Biol. 2006. PMID: 16984813 Review.
-
Selective alterations in presynaptic cytomatrix protein organization induced by calcium and other divalent cations that modulate exocytosis.J Neurochem. 1990 May;54(5):1700-8. doi: 10.1111/j.1471-4159.1990.tb01224.x. J Neurochem. 1990. PMID: 2324744
Cited by
-
Roles of the CCR4-Not complex in translation and dynamics of co-translation events.Wiley Interdiscip Rev RNA. 2023 Nov 27;15(1):e1827. doi: 10.1002/wrna.1827. Online ahead of print. Wiley Interdiscip Rev RNA. 2023. PMID: 38009591 Free PMC article. Review.
-
Decreased proliferation of HepG2 liver cancer cells in vitro and exhibited proteomic changes in vivo in subjects with metabolic syndrome and metabolic dysfunction-associated steatotic liver disease who performed four-week dawn-to-dusk dry fasting.Clin Proteomics. 2025 Jun 24;22(1):25. doi: 10.1186/s12014-025-09547-3. Clin Proteomics. 2025. PMID: 40551123 Free PMC article.
-
eIF6: a promising therapeutic target for gastric carcinoma via PI3K/AKT pathway modulation.World J Surg Oncol. 2025 Apr 1;23(1):113. doi: 10.1186/s12957-025-03746-w. World J Surg Oncol. 2025. PMID: 40170052 Free PMC article.
-
Cytoplasmic physicochemical factors drive malignant transformation by adapting bioenergetic settings.Biochem Biophys Rep. 2025 Jun 7;43:102079. doi: 10.1016/j.bbrep.2025.102079. eCollection 2025 Sep. Biochem Biophys Rep. 2025. PMID: 40535783 Free PMC article.
References
-
- Taylor C.V. The contractile vacuole in Euplotes: an example of the sol-gel reversibility of cytoplasm. J. Exp. Zool. 1923;37:259–289. doi: 10.1002/jez.1400370302. - DOI
Grants and funding
LinkOut - more resources
Full Text Sources
Molecular Biology Databases
Miscellaneous
