[Preprint]. 2023 Feb 19:2023.02.19.526140.
doi: 10.1101/2023.02.19.526140.

Single-strand mismatch and damage patterns revealed by single-molecule DNA sequencing

Affiliations

Single-strand mismatch and damage patterns revealed by single-molecule DNA sequencing

Mei Hong Liu et al. bioRxiv. .

Update in

  • DNA mismatch and damage patterns revealed by single-molecule sequencing.
    Liu MH, Costa BM, Bianchini EC, Choi U, Bandler RC, Lassen E, Grońska-Pęski M, Schwing A, Murphy ZR, Rosenkjær D, Picciotto S, Bianchi V, Stengs L, Edwards M, Nunes NM, Loh CA, Truong TK, Brand RE, Pastinen T, Wagner JR, Skytte AB, Tabori U, Shoag JE, Evrony GD. Liu MH, et al. Nature. 2024 Jun;630(8017):752-761. doi: 10.1038/s41586-024-07532-8. Epub 2024 Jun 12. Nature. 2024. PMID: 38867045 Free PMC article.

Abstract

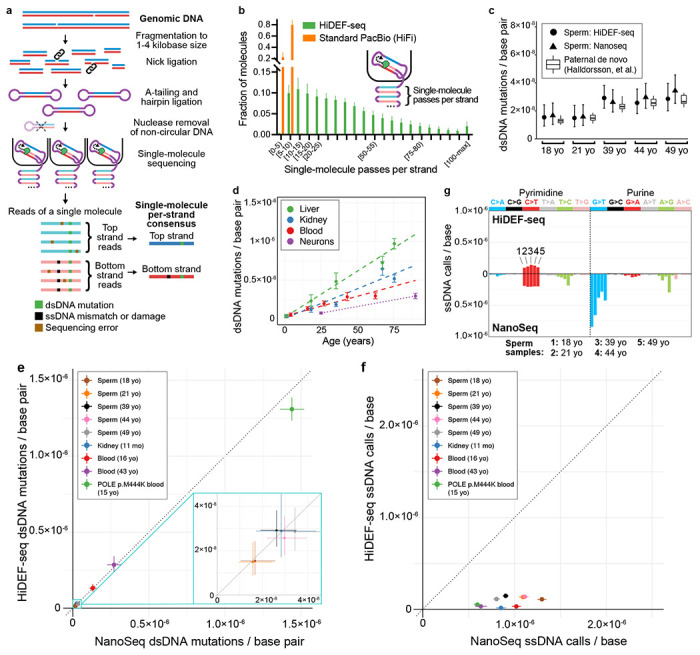
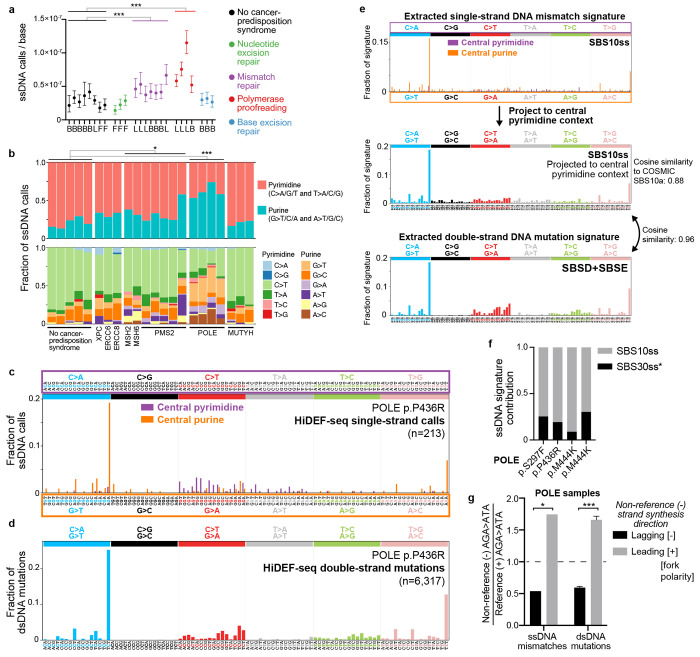
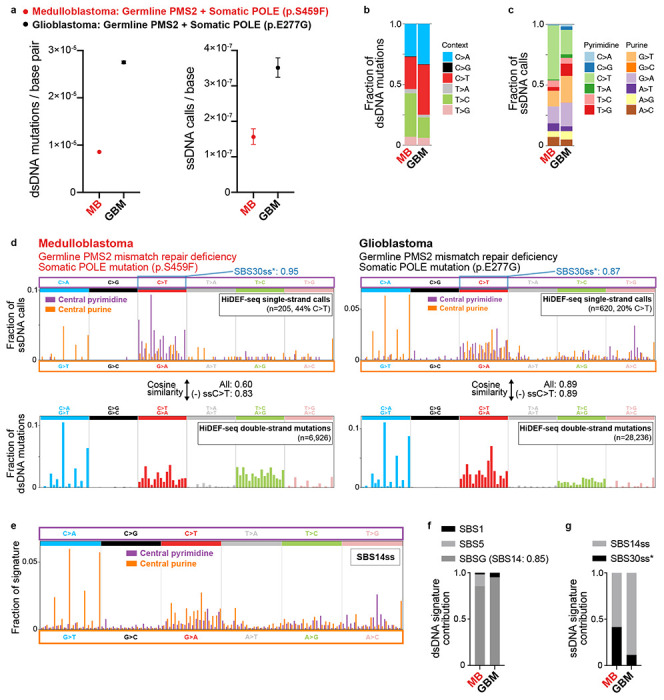
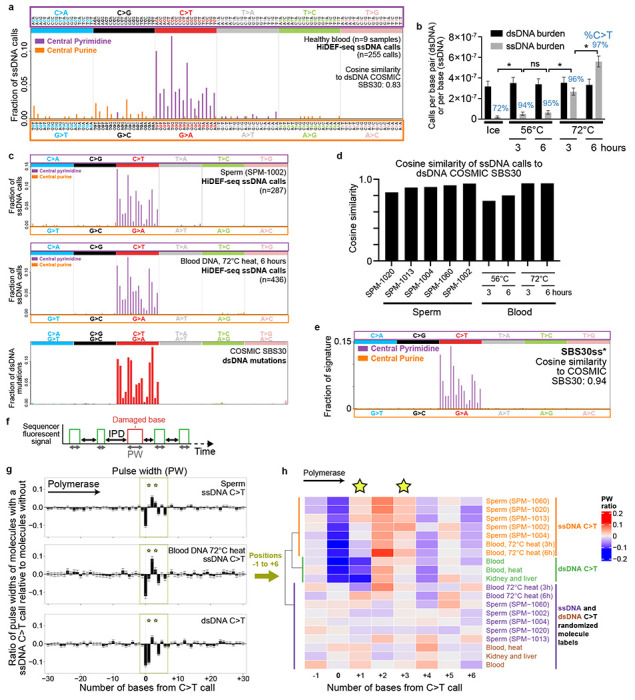
Mutations accumulate in the genome of every cell of the body throughout life, causing cancer and other genetic diseases1-4. Almost all of these mosaic mutations begin as nucleotide mismatches or damage in only one of the two strands of the DNA prior to becoming double-strand mutations if unrepaired or misrepaired5. However, current DNA sequencing technologies cannot resolve these initial single-strand events. Here, we developed a single-molecule, long-read sequencing method that achieves single-molecule fidelity for single-base substitutions when present in either one or both strands of the DNA. It also detects single-strand cytosine deamination events, a common type of DNA damage. We profiled 110 samples from diverse tissues, including from individuals with cancer-predisposition syndromes, and define the first single-strand mismatch and damage signatures. We find correspondences between these single-strand signatures and known double-strand mutational signatures, which resolves the identity of the initiating lesions. Tumors deficient in both mismatch repair and replicative polymerase proofreading show distinct single-strand mismatch patterns compared to samples deficient in only polymerase proofreading. In the mitochondrial genome, our findings support a mutagenic mechanism occurring primarily during replication. Since the double-strand DNA mutations interrogated by prior studies are only the endpoint of the mutation process, our approach to detect the initiating single-strand events at single-molecule resolution will enable new studies of how mutations arise in a variety of contexts, especially in cancer and aging.


Conflict of interest statement

Competing Interests A provisional patent application on HiDEF-seq has been filed (NYU Grossman School of Medicine). G.D.E. owns stock in DNA sequencing companies (Illumina, Oxford Nanopore Technologies, and Pacific Biosciences).

Figures

Figure 1.
Figure 1.. Overview of method.
a, Schematic of library preparation and sequencing. A-tailing is performed with a polymerase, dATP and non-A dideoxynucleotides to block residual nicks (not illustrated), except for fragmented DNA samples that utilize only dideoxynucleotides (without dATP) in this step to avoid misincorporation of dATP at these samples’ more numerous residual nick sites (Extended Data Fig. 5 and Methods). Sequencing reads are reverse complements of the template molecule. b, Histogram of the average number of passes per strand (Methods) in single-molecule sequencing of representative HiDEF-seq samples (n=51) and standard Pacific Biosciences (PacBio HiFi) samples (n=10). The average percentage of molecules with ≥ 5 and ≥ 20 passes per strand is: 99.8% and 70% for HiDEF-seq, respectively, and 78.7% and 0.1% for HiFi, respectively. Plot shows HiDEF-seq molecules output by the primary data processing step of the analysis pipeline. X-axis square brackets and parentheses signify inclusion and exclusion of interval endpoints, respectively. c, dsDNA mutation burdens in sperm samples (left to right: SPM-1013, SPM-1002, SPM-1004, SPM-1020, SPM-1060) profiled by both HiDEF-seq v2 and NanoSeq, compared for each age (yo, years old) to paternally-phased de novo mutations in children from a prior study of 2,976 trios. d, dsDNA mutation burdens versus age measured by HiDEF-seq v2 in samples from individuals without cancer predisposition. Dashed lines (liver, kidney, blood): weighted least-squares linear regression. Dotted line (neurons): these only connect two data points to aid visualization of burden difference, since regression cannot be performed with two samples. e, Comparison of HiDEF-seq versus NanoSeq dsDNA mutations per base pair for samples profiled by both methods. Samples (top to bottom in legend) are: SPM-1013, SPM-1002, SPM-1004, SPM-1020, SPM-1060, 1443, 1105, 6501, 63143. Note, all samples except for 63143 (POLE p.M444K) are from individuals without a cancer predisposition syndrome. Dashed line diagonal, y = x, is the expectation for concordance. f, Comparison of HiDEF-seq versus NanoSeq ssDNA calls per base for samples profiled by both methods. These are the same samples as in (e). g, Comparison of HiDEF-seq versus NanoSeq ssDNA calls per base, separated by call type. For each call type (i.e., C>A, C>G, etc.), each bar represents a different sperm sample. Samples for each call type, from left to right, are SPM-1013, SPM-1002, SPM-1004, SPM-1020, SPM-1060. b, Error bars: standard deviation. c-f, Error bars: Poisson 95% confidence intervals. c, Box plots: middle line, median; boxes, 1st and 3rd quartiles; whiskers, 5% and 95% quantiles. c,e,f, For each sample, HiDEF-seq and NanoSeq confidence intervals were normalized to reflect an equivalent number of interrogated base pairs (c,e) or bases (f) (Methods). e-g, yo, years old; mo, months old.
Figure 2.
Figure 2.. ssDNA call burdens and patterns in cancer-predisposition syndromes.
a, Burdens of ssDNA calls in blood (B), fibroblasts (F), and lymphoblastoid cell lines (L) from individuals without and with cancer predisposition syndromes. Call burdens are corrected for trinucleotide context opportunities and detection sensitivity (Methods). ***, p = 8·10−11 for mismatch repair versus non-cancer predisposition samples and p < 10−15 for polymerase proofreading versus non-cancer predisposition samples (Poisson rates ratio test, using combined counts of calls and interrogated bases from each group). Results were still significant when including only blood samples. From left to right, non-cancer predisposition samples are: 5203, 1105, 1301, 6501, 1901, GM12812, GM02036, GM03348; cancer predisposition samples are: GM16381, GM01629, GM28257, 55838, 58801, 57627, 1400, 1324, 1325, 60603, 59637, 57615, 63143 (L), 63143 (B), CC-346-253, CC-388-290, CC-713-555. For cancer predisposition samples, the affected genes are in the same left-right order as for cancer predisposition samples in (b). b, Fraction of ssDNA call burdens by context, corrected for trinucleotide context opportunities. We include only non-cancer predisposition samples with > 30 ssDNA calls (1105, 1301, 1901, GM12812, GM03348) for reliable fraction estimates. However, the cancer predisposition sample GM16381 (XPC) with < 30 ssDNA calls is included for completeness to show all cancer predisposition samples. The cancer predisposition syndrome samples are in the same order as in (a). c,d, ssDNA (c) and dsDNA (d) call spectra for representative POLE sample 57615, corrected for trinucleotide context opportunities. Parentheses show total number of calls. e, Top, ssDNA mismatch signature SBS10ss extracted from all POLE samples. The signature was extracted de novo while simultaneously fitting SBS30ss* (see Fig. 4e). Middle, SBS10ss projected to central pyrimidine context by summing central pyrimidine and their reverse complement central purine values to allow comparison to dsDNA signatures. Bottom, dsDNA mutational signature (sum of SBSD and SBSE) extracted de novo from all POLE samples, while simultaneously fitting SBS1 and SBS5. f, Fraction of ssDNA calls attributed to each ssDNA signature in POLE samples (left to right): 59637, 57615, and 63143 lymphoblastoid cell lines, and 63143 blood. Protein-level POLE mutation is annotated below. Cosine similarities of original spectra of samples to spectra reconstructed from component signatures are (left to right): 0.94, 0.97, 0.97, 0.85. See Fig. 4e for details of SBS30ss*. g, In POLE samples, AGA>ATA ssDNA mismatches and AGA>ATA dsDNA mutations occur more often on the non-reference (−) than on the reference (+) strand in regions where the non-reference strand is synthesized more frequently in the leading direction (i.e., positive fork polarity), based on replication timing data (Methods). Reference (+) strand refers to the plus strand of the human reference genome. See Extended Data Fig. 7e for plots of dsDNA mutations separated by fork polarity quantiles (rather than positive versus negative polarity), which cannot be plotted for ssDNA mismatches due to the low number of ssDNA mismatches per quantile. Y-axis is the ‘strand ratio’, calculated as the fraction of all AGA>ATA non-reference strand events that have the specified fork polarity divided by the fraction of all AGA>ATA reference strand events that have the specified fork polarity. For ssDNA analysis, the strand ratio is calculated using the ssDNA mismatches of all POLE samples, since there are not enough ssDNA mismatches to quantify this reliably for each sample separately. For dsDNA analysis, strand ratios were calculated for each sample separately, and the plot shows average and standard deviation (error bars) across these samples. Dashed line at 1.0 is the expected ratio in the absence of strand asymmetry. *, p = 0.015 (chi-squared test, n = 73 ssDNA AGA>ATA mismatches); ***, p < 10−15 (chi-squared test of all 3,871 dsDNA AGA>ATA mutations across all POLE samples). An analysis excluding mismatches and mutations overlapping genes, to exclude biases due to transcription strand, was still significant for dsDNA mutations (p < 10−15) but not for ssDNA mismatches, but this analysis has significantly reduced power due to the 55% reduction in the number of ssDNA mismatches remaining for analysis. a,b, See further disease and sample details, including genotypes, in Supplementary Tables 1–2. a, Error bars, Poisson 95% confidence intervals.
Figure 3.
Figure 3.. Tumors deficient in both mismatch repair and polymerase proofreading.
a, Burdens of dsDNA mutations (left) and ssDNA calls (right) in a medulloblastoma (ID: Tumor 8) and glioblastoma (ID: Tumor 10). See Supplementary Table 1 for sample details. Burdens are corrected for trinucleotide context opportunities and detection sensitivity (Methods). b,c, Fraction of dsDNA mutation burdens (b) and ssDNA call burdens (c) by context, corrected for trinucleotide context opportunities. d, Spectra of ssDNA calls (top) and dsDNA mutations (bottom) in tumor samples corrected for trinucleotide context opportunities. Parentheses show the total number of raw calls, and the percentage of calls that are C>T after correction for trinucleotide context opportunities. Blue annotation on the top right of each ssDNA spectrum is the cosine similarity of only the ssDNA C>T calls to SBS30ss* (see Fig. 4e for details of SBS30ss*). Also annotated are the cosine similarities of each sample’s full ssDNA call spectrum (projected to central pyrimidine context) to its dsDNA mutation spectrum, for all ssDNA calls and excluding ssDNA C>T calls (most of which are due to the SBS30ss* cytosine deamination process). e, ssDNA mismatch signature SBS14ss extracted from tumor samples. The signature was extracted de novo while simultaneously fitting SBS30ss*. f, Fraction of dsDNA mutations attributed to each dsDNA signature in tumor samples. Cosine similarity of the de novo extracted signature SBSG to the best matching COSMIC SBS signature is shown in parentheses. Cosine similarities of original spectra of samples to spectra reconstructed from component signatures are (left to right): 0.94 and 0.998. g, Fraction of ssDNA calls attributed to each ssDNA signature in tumor samples. Cosine similarities of original spectra of samples to spectra reconstructed from component signatures are (left to right): 0.91 and 0.98. a, Error bars, Poisson 95% confidence intervals. a-c,f,g, MB, medulloblastoma (ID: Tumor 8); GBM, glioblastoma (ID: Tumor 10).
Figure 4.
Figure 4.. ssDNA damage signatures in sperm and after heat treatment
a, Spectrum of all ssDNA calls of non-cancer predisposition (healthy) blood samples (1 sample each from individuals 1105, 1301, 5203, 6501, and 5 samples from individual 1901). Cosine similarity to the dsDNA COSMIC signature SBS30 is calculated after projecting the ssDNA spectrum to a central pyrimidine trinucleotide spectrum (by summing values of central pyrimidine and their reverse complement central purine contexts). b, dsDNA mutation and ssDNA call burdens of heat-treated DNA. Non-heat-treated DNA was placed on ice for 6 hours. DNA heat-treated for 3 hours was subsequently placed on ice for 3 hours. The percentage of ssDNA sequencing calls that are C>T are annotated above each sample. c, Spectra of ssDNA calls for representative sperm and heat-treated blood DNA samples, and COSMIC SBS30 for comparison. d, Cosine similarity of ssDNA call spectra of each individual sperm and heat-treated blood sample to COSMIC SBS30, after projecting ssDNA calls to central pyrimidine trinucleotide contexts. e, SBS30ss* obtained by de novo signature extraction from central pyrimidine ssDNA calls of sperm and heat-treated samples. Cosine similarity to SBS30 is calculated after projecting to central pyrimidine trinucleotide context. f, Schematic of pulse width (PW) and interpulse duration (IPD) measured by the sequencer for each incorporated base. g, Average ratio of pulse widths at C>T call locations and 30 flanking bases of each molecule with a C>T call relative to molecules aligning to the same locus without the call. Data shows the average of the ratios for all ssDNA C>T calls in sperm samples (n=1799 calls), blood DNA samples that were heat-treated at 72C for 3 or 6 hours (n=626 calls), and dsDNA C>T mutations in a larger set of samples (non-heat treated blood DNA, 56C and 72C heat treated blood DNA, sperm, kidney, and liver; n=1217 mutations). The distinct profile of ssDNA C>T calls versus dsDNA C>T mutations, most notably at positions +1 and +3 (stars), indicates the ssDNA calls are damaged cytosines rather than cytosine to thymine mutations. h, Heat map of average pulse width ratios for C>T ssDNA calls and C>T dsDNA mutations for positions −1 to +6. Unbiased clustering of kinetic profiles (dendrogram) separates ssDNA from dsDNA calls and from kinetic profiles after randomizing labels of molecules with and without the calls. ssDNA ‘Blood, 72C heat (3h and 6h)’ (h, hours): heat-treated blood DNA. dsDNA ‘Blood, heat’: blood DNA heat-treated at 56C and 72C (both 3h and 6h for each); dsDNA ‘Blood’: 4 samples, not heat treated. dsDNA ‘Kidney and liver’: 10 samples, not heat treated. Star indicates positions +1 and +3 that best discriminate ssDNA C>T damage from dsDNA C>T mutations. b, Error bars, Poisson 95% confidence intervals. *, p < 0.005; ns, p>0.05; Poisson rates ratio test. a,c-e, HiDEF-seq spectra are corrected for trinucleotide context opportunities (Methods). g, Error bars, standard error of the mean.
Figure 5.
Figure 5.. ssDNA call burdens and patterns in samples from healthy individuals.
a, Fraction of ssDNA calls that are C>T (corrected for trinucleotide context opportunities) across all HiDEF-seq samples from healthy individuals and cell lines (i.e., excluding cancer-predisposition syndromes), versus the total ssDNA call burden. LCL, lymphoblastoid cell line. b, ssDNA call burden versus age across all HiDEF-seq v2 samples from healthy individuals (primary tissues only). Dashed lines: weighted least-squares linear regression, with a 95% confidence interval (shaded ribbon) shown for the statistically significant association for liver. c, Fraction of ssDNA call burdens by context for samples from healthy individuals and cell lines, after pooling calls separately for each tissue. Call burdens are corrected for trinucleotide context opportunities. See Extended data Figs. 9d,e for ssDNA and dsDNA call burdens by context for individual samples, and Extended data Fig. 9f for ssDNA spectra for each tissue. b, Error bars, Poisson 95% confidence intervals.
Figure 6.
Figure 6.. Mitochondrial genome dsDNA and ssDNA call burdens and patterns.
a, dsDNA mutation burdens versus age in the mitochondrial genome of liver and kidney samples, including liver samples from which mitochondria were enriched. Dashed lines: weighted least-squares linear regression (p < 0.0005 and p = 0.003 for regression slope for liver and kidney, respectively), with a 95% confidence interval (shaded ribbon). b, dsDNA mutation burdens per year in the nuclear versus mitochondrial genome. Liver and kidney mitochondrial genome data is from the regressions in panel (a), which were similarly performed for the nuclear genome as well as for liver and kidney samples combined. P-values, comparing the nuclear versus mitochondrial genome within each tissue type, obtained from an ANOVA comparing two weighted least-squares linear regression models of mutation burden versus age and genome type covariates: one with and one without an ‘age x genome type’ interaction term (an estimate of the difference of the dsDNA mutation burden slope versus age depending on whether it is the nuclear or mitochondrial genome). c, dsDNA mutation spectra in liver and kidney samples for the mitochondrial genome heavy strand, separated by pyrimidine (top) and purine (bottom) contexts. d, ssDNA call burdens in the nuclear versus mitochondrial genomes. Calls are pooled from liver and kidney samples, including liver samples from which mitochondria were enriched (n=1126 and n=27 nuclear and mitochondrial genome calls, respectively). P-value, ANOVA. e, Spectrum of ssDNA calls combined from liver and kidney samples, including samples profiled by HiDEF-seq v2 with A-tailing, as well as liver samples from which mitochondria were enriched. a,d, Error bars, Poisson 95% confidence intervals. b, Error bars, 95% confidence intervals from regressions. c,e, Spectra are corrected for trinucleotide context opportunities.

References

    1. Martincorena I. & Campbell P. J. Somatic mutation in cancer and normal cells. Science 349, 1483 (2015). - PubMed
    1. Mustjoki S. & Young N. S. Somatic Mutations in “Benign” Disease. New England Journal of Medicine 384, 2039–2052 (2021). - PubMed
    1. Moore L. et al. The mutational landscape of human somatic and germline cells. Nature 597, 381–386 (2021). - PubMed
    1. Vijg J. & Dong X. Pathogenic Mechanisms of Somatic Mutation and Genome Mosaicism in Aging. Cell 182, 12–23 (2020). - PMC - PubMed
    1. Seplyarskiy V. B. & Sunyaev S. The origin of human mutation in light of genomic data. Nature Reviews Genetics 22, 672–686 (2021). - PubMed

Methods References

    1. Agarwal A., Gupta S. & Sharma R. in Andrological Evaluation of Male Infertility: A Laboratory Guide (eds Agarwal Ashok, Gupta Sajal, & Sharma Rakesh) 101–107 (Springer International Publishing, 2016).
    1. Wu H., de Gannes M. K., Luchetti G. & Pilsner J. R. Rapid method for the isolation of mammalian sperm DNA. BioTechniques 58, 293–300 (2015). - PMC - PubMed
    1. Jenkins T. G., Liu L., Aston K. I. & Carrell D. T. Pre-screening method for somatic cell contamination in human sperm epigenetic studies. Systems Biology in Reproductive Medicine 64, 146–155 (2018). - PubMed
    1. Nurk S. et al. The complete sequence of a human genome. bioRxiv, 2021.2005.2026.445798 (2021).
    1. Heng L. Aligning sequence reads, clone sequences and assembly contigs with BWA-MEM. arXiv (2013).

Publication types