[Preprint]. 2023 Feb 15:2023.02.14.528445.
doi: 10.1101/2023.02.14.528445.

The Energetics and Ion Coupling of Cholesterol Transport Through Patched1

Affiliations

The Energetics and Ion Coupling of Cholesterol Transport Through Patched1

T Bertie Ansell et al. bioRxiv. .

Update in

Abstract

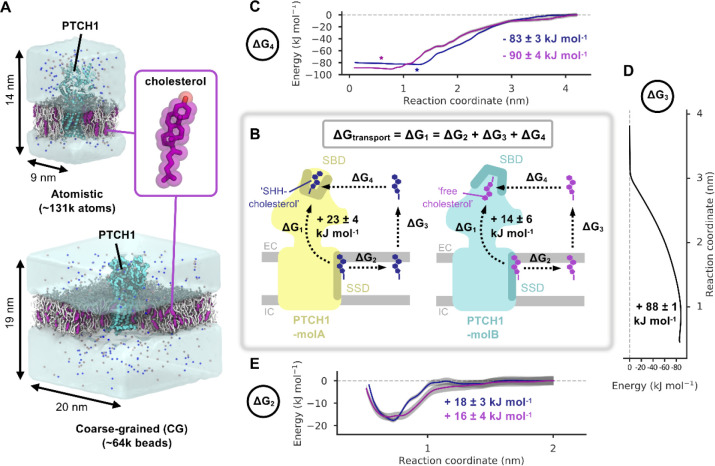
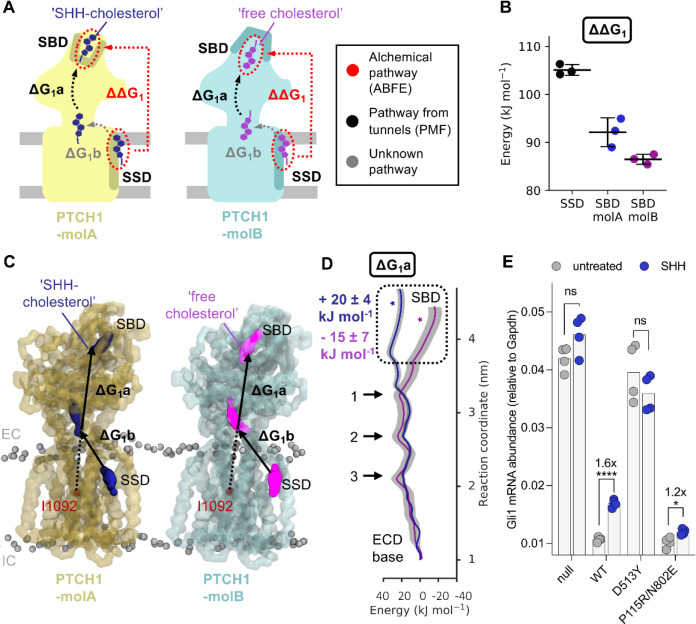
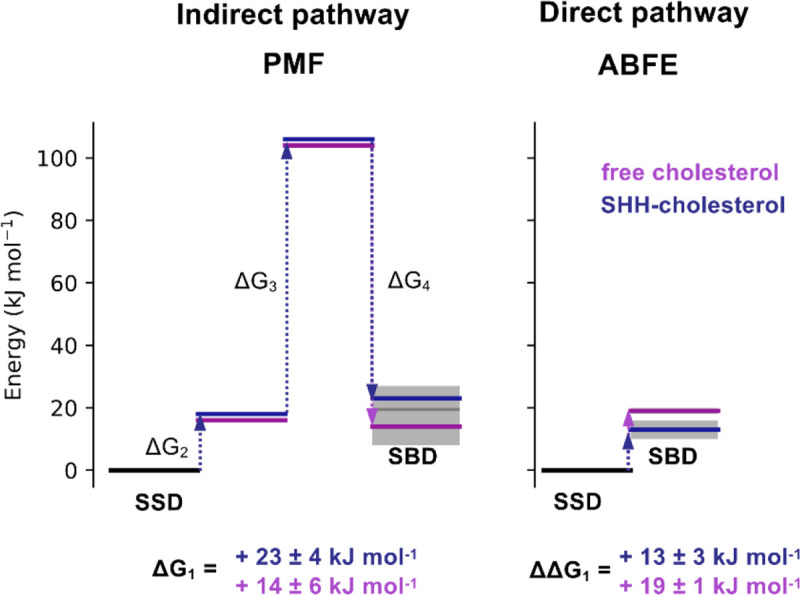
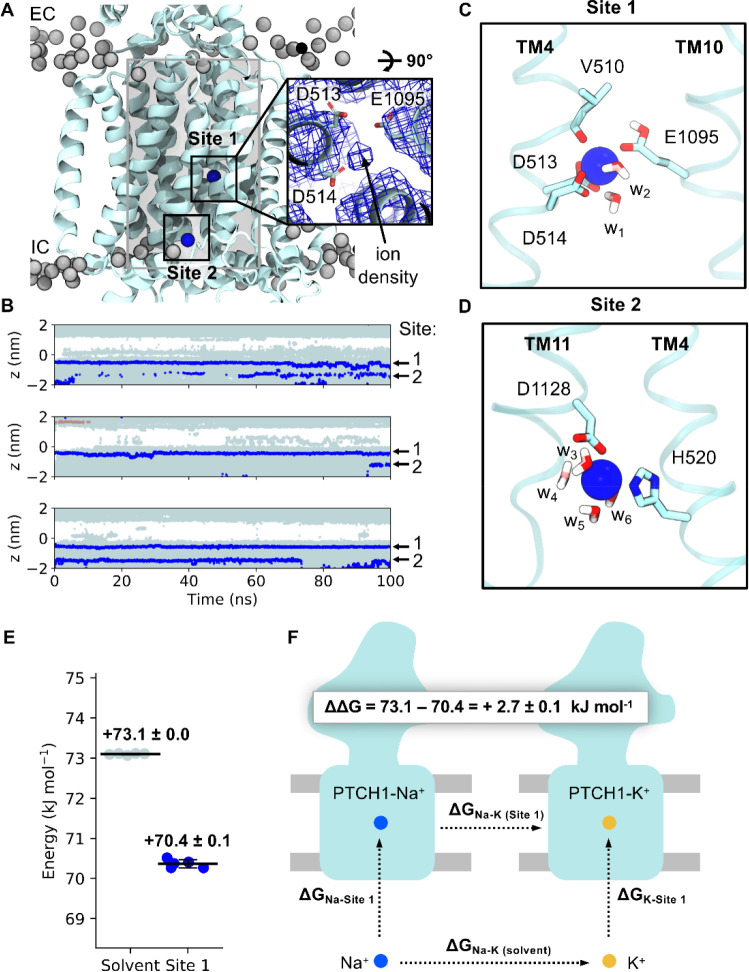
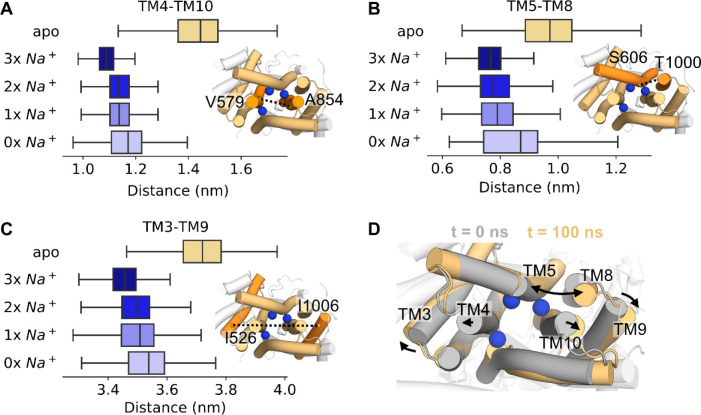
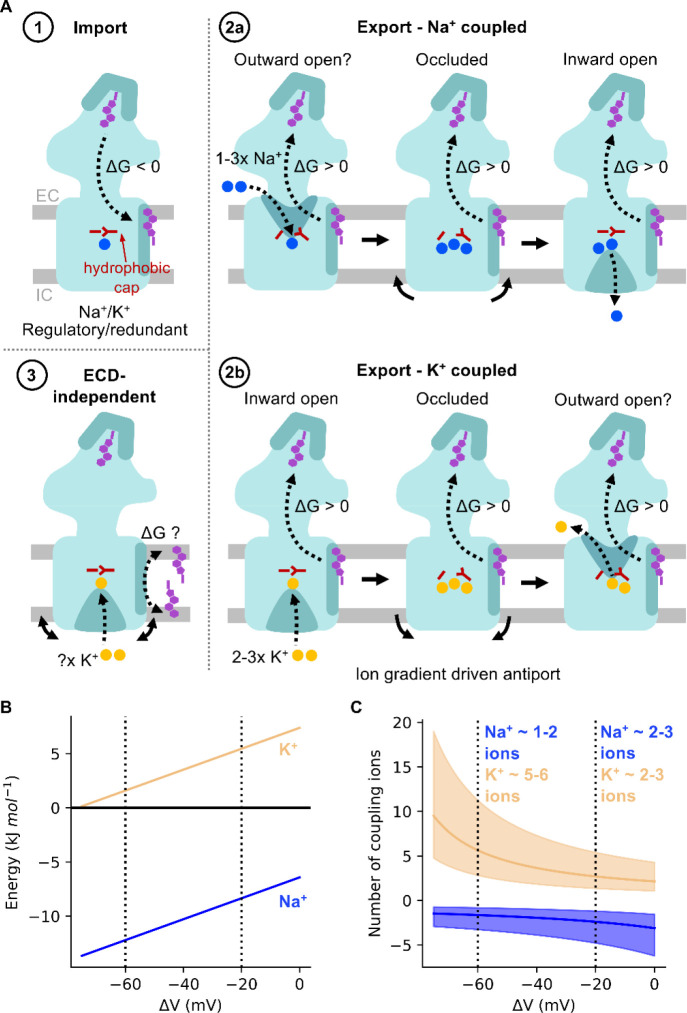
Patched1 (PTCH1) is the principal tumour suppressor protein of the mammalian Hedgehog (HH) signalling pathway, implicated in embryogenesis and tissue homeostasis. PTCH1 inhibits the Class F G protein-coupled receptor Smoothened (SMO) via a debated mechanism involving modulating accessible cholesterol levels within ciliary membranes. Using extensive molecular dynamics (MD) simulations and free energy calculations to evaluate cholesterol transport through PTCH1, we find an energetic barrier of ~15-20 kJ mol -1 for cholesterol export. In simulations we identify cation binding sites within the PTCH1 transmembrane domain (TMD) which may provide the energetic impetus for cholesterol transport. In silico data are coupled to in vivo biochemical assays of PTCH1 mutants to probe coupling between transmembrane motions and PTCH1 activity. Using complementary simulations of Dispatched1 (DISP1) we find that transition between 'inward-open' and solvent 'occluded' states is accompanied by Na + induced pinching of intracellular helical segments. Thus, our findings illuminate the energetics and ion-coupling stoichiometries of PTCH1 transport mechanisms, whereby 1-3 Na + or 2-3 K + couple to cholesterol export, and provide the first molecular description of transitions between distinct transport states.


Figures

Figure 1:
Figure 1:. Patched1 and the energetics of cholesterol transport - the indirect pathway.
A) Coarse-grained (CG) and atomistic simulation setups of PTCH1 (light blue, PDB: 6RVD (CG)/6DMY (atomistic)) embedded in 3:1 POPC:cholesterol (white/purple) bilayers. Water is shown as transparent surface and Na+/Cl ions are shown as blue/salmon spheres respectively. The inset shows the structure of cholesterol. B) Schematic diagram of the free energy changes associated with cholesterol movement between the PTCH1 sterol sensing domain (SSD) and the sterol binding domain (SBD) for the direct (ΔG1) and indirect (ΔG2, ΔG3, ΔG4) pathways. PTCH1-molA (yellow) and PTCH1-molB (light blue) are shown with either the ‘SHH-cholesterol’ (dark blue) or the ‘free cholesterol’ (purple) molecules positioned in the SBD and SSD (teal/ochre). The position of the extracellular (EC) and intracellular (IC) membrane leaflets are indicated in grey. C-E) CG potential of mean force (PMF) profiles for movement of ‘free cholesterol’ (purple) and ‘SHH-cholesterol’ (dark blue) between the SBD and the solvent (ΔG4) (C) or the SSD and the bulk membrane (ΔG2) (E) or for extraction of cholesterol from the membrane into the solvent (ΔG3) (D). Bayesian bootstrapping (2000 rounds) was used to estimate profile errors (grey). Stars indicate the position of the ‘SHH-cholesterol’ (within PTCH1-molA) and ‘free cholesterol’ (within PTCH1-molB) densities in a revised cryo-EM structure (PDB: 6RVD).
Figure 2:
Figure 2:. Cholesterol transport energetics - the direct pathway.
A) Schematic diagram of the free energy changes associated with cholesterol movement between the SSD and SBD of PTCH1 for the direct pathway, coloured identically to in Fig. 1B. Decoupling of cholesterol from the SBD/SSD sites are indicated by red circles, with the difference between them (ΔΔG1) shown as a red arrow to indicate alchemical transformation. A black arrow indicates shows movement of cholesterol between the ECD base and the SBD, used in PMF calculations to derive ΔG1a. Grey arrows correspond to currently uncertain regions of the transport pathway. B) The free energy values of decoupling cholesterol from the SSD (PTCH1-molA) and SBD (PTCH1-molA and PTCH1-molB) as obtained from absolute binding free energy (ABFE) calculations. C) Snapshots from PMF-1a indicating movement of cholesterol between the ECD base and SBD of PTCH1 (residues used in the steered MD are labelled in red). CG representation of PTCH1 backbone beads are shown in transparent light blue/yellow, ‘free cholesterol’ is coloured purple, ‘SHH-cholesterol’ is coloured dark blue and lipid phosphate beads are shown in grey. D) PMF profile for cholesterol movement through the ECD of PTCH1-molA/B (ΔG1a) (see C). Bootstrapping errors (2000 rounds) are shown in grey. The position of cholesterol within the SBD pocket in the cryo-EM model (PDB: 6RVD) is starred. Arrows in D indicate energetic peaks 1–3 within the ECD core conserved between PTCH1-molA and PTCH1-molB (see Supplementary Fig. 7). E) HH signalling strength is determined by measuring endogenous Gli1 mRNA abundances (normalized to the control Gapdh) in response to SHH ligands (200 nM, 20 hours) in Ptch1−/− cells stably expressing the indicated variants. Statistical significance is determined by a Student’s t-test with a Welch’s correction. Exact P values for comparisons: Ptch1−/− untreated vs. SHH = 0.085, WT untreated vs. SHH < 0.0001, D513Y untreated vs. SHH = 0.2712, and P155R/N802E untreated vs. SHH = 0.0205. not significant (ns), *P > 0.05, *P ≤ 0.05, **P ≤ 0.01, ***P ≤ 0.001, and ****P ≤ 0.0001.
Figure 3:
Figure 3:. Movement of cholesterol between the SSD and SBD is associated with an energetic barrier.
Comparison of ΔG1 values for ‘free cholesterol’ (purple) and ‘SHH-cholesterol’ (dark blue) movement between the PTCH1 SSD and SBD, derived from the indirect (PMF, Fig. 1) and direct (ABFE, Fig. 2) pathways. Step wise free energy changes are shown as connecting arrows and are labelled. ΔG1 from the indirect pathway was calculated in quadrature (Equation 1) since PMFs 2–4 were independent. In all cases cholesterol movement from the SSD to the SBD gives ΔG > 0 kJ mol−1.
Figure 4:
Figure 4:. Identification and selectivity of cation binding sites within the PTCH1 TMD.
A) Snapshot from atomistic simulations of PTCH1 (light blue, PDB: 6DMY) indicating the location of cation binding sites within the TMD. Na+ ions are shown as blue spheres and lipid phosphates are grey. Inset: cation-like density surrounded by anionic tired residues at Site 1 within the cryo-EM structure, as viewed from the extracellular face. A cylinder (length 4 nm, radius 1.3 nm) centred on the midpoint of V520 and I1092 Cα atoms is shown in grey and was used to identify water and ions within the PTCH1 TMD (B). B) The z coordinates of water oxygen atoms (light blue), Na+ (blue) and Cl (salmon) ions localised within the PTCH1 TMD (see A, grey cylinder) over the length of 3 × 100 ns simulations initiated with Na+ bound at the density observed in A. Snapshots of Site 1 (C) and Site 2 (D) showing coordination of bound Na+ ions by surrounding residues (stick representation) or waters (w1–6). E) Free energy perturbation (FEP) calculations for alchemical transformation of Na+ into K+ within the solvent or bound to Site 1. F) Schematic representation of the free energy cycle used to calculate the difference in Na+ binding to Site 1 compared to K+ (ΔΔG).
Figure 5:
Figure 5:. Identification of ‘inward-open’ and solvent ‘occluded’ PTCH1/DISP1 conformations.
A) Time averaged water density (blue isosurface) across a 100 ns simulation of PTCH1 (PDB: 6DMY) initiated with Na+ bound at Site 1. PTCH1 TMD is shown in ribbon representation and anionic triad residues are shown as spheres. Yellow arrows indicate paths for water entry into the TMD. B) Residues comprising the hydrophobic cap (red box in A) shown in stick and surface representation, as viewed from the extracellular (EC) face. V510 and I1092 forming part of the conserved GXXXDD and GXXX(E/D) motifs on TM4 and TM10 are boxed in blue. Residues mutated in disease phenotypes are boxed in black. C) Mean number of waters per frame within the EC half of the PTCH1 TMD across the final 10 ns of 3 × 50 ns simulations of WT PTCH1 or PTCH1 mutants (see Extended Methods). D) HH signalling strength is determined by measuring endogenous Gli1 mRNA abundances (normalized to the control Gapdh) in response to SHH ligands (200 nM, 20 hours) in Ptch1−/− cells stably expressing the indicated variants. Statistical significance is determined by a Student’s t-test with a Welch’s correction. Exact P values for comparisons: Ptch1−/− untreated vs. SHH = 0.085, WT untreated vs. SHH < 0.0001, D513Y untreated vs. SHH = 0.2712, V510F untreated vs. SHH = 0.0002, L517C/P1125C untreated vs. SHH = 0.0255, and L570C/V1081C untreated vs. SHH = 0.0014. not significant (ns), *P > 0.05, *P ≤ 0.05, **P ≤ 0.01, ***P ≤ 0.001, and ****P ≤ 0.0001. E) Comparison of cation binding sites within PTCH1 and DISP1 (PDB: 7RPH) TMDs. Anionic triad residues are shown as sticks. F) Time averaged water density profiles across 100 ns simulations of DISP1 in apo or ‘3x Na+’ bound conformations. G) Mean number of waters per frame within the intracellular (IC) half of the DISP1 TMD across the final 10 ns of 3 × 100 ns simulations of DISP1 in apo and ‘3x Na+’ bound states, or in ‘2x Na+’, ‘1x Na+’ and ‘0x Na+’ bound states generated by sequential ion removal from the end of the previous Na+ bound state or PTCH1 in apo, ‘3x Na+’ and ‘3x K+’ bound states (see Extended Methods). C and G report the mean and standard deviation between repeats.
Figure 6:
Figure 6:. Na+ interdigitates the DISP1 intracellular TMD helices.
A-C) Minimum distances between the intracellular portions of DISP1 helices across 3 × 100 ns simulations of DISP1 in apo, ‘3x Na+’, ‘2x Na+, ‘1x Na+’ and ‘0x Na+’ bound states. Distances were calculated between the Cα atoms of labelled residues on A) TM4-TM10, B) TM5-TM8 and C) TM3-TM9. Snapshots of the DISP1 TMD from the intracellular face are shown, with black lines marking the distance between helices (orange). D) Expansion of the intracellular TMD helices as indicated by comparison of the start (grey) and end (yellow) snapshots from a simulation of apo DISP1. The position of Na+ ions (blue spheres) are overlayed for reference.
Figure 7:
Figure 7:. Energetics and ion coupling of PTCH1 transport models.
A) Proposed models for PTCH1 function (coloured as in Fig. 1). Model-1: PTCH1 imports cholesterol extracted from SMO to a membrane sequestered pool or intracellular donor (energetically favourable). Model-2: Accessible cholesterol export by PTCH1 mediated by coupling to 1–3 Na+ ions (blue, model-2a) or 2–3 K+ ions (yellow, model-2b). Transition between ‘inward-open’ and ‘occluded’ states accompanied by breathing-like motions of intracellular helical segments (solid arrows) and alleviation of the hydrophobic cap (red). Model-3: PTCH1 re-partitions accessible cholesterol to an intramembrane sequestered pool (e.g. partnered with sphingomyelin) or intracellular acceptor. B) Free energy stored across the Na+ (blue) and K+ (yellow) membrane gradients as a function of membrane potential (ΔV) (Equation 2). C) Predicted number of Na+/K+ coupling ions required per cholesterol exported by PTCH1 (defined as ‘cholesterol export free energy’/’free energy across cation potential’ from B) vs membrane potential (ΔV). A cholesterol export free energy of +20 kJ mol−1 is indicated by a solid line, with export energies ranging between +10 to +40 kJ mol−1 indicated in transparent. Standard cellular ion concentrations ([Na+]in: 12 mM, [Na+]out: 145 mM, [K+]in: 150 mM, [K+]out: 4 mM) are assumed.

References

    1. Kong J. H., Siebold C. & Rohatgi R. Biochemical mechanisms of vertebrate hedgehog signaling. Development 146, 1–17 (2019). - PMC - PubMed
    1. Marigo V., Davey R. A., Zuo Y., Cunningham J. M. & Tabin C. J. Biochemical evidence that Patched is the Hedgehog receptor. Nature 384, 176–179 (1996). - PubMed
    1. Wu F., Zhang Y., Sun B., McMahon A. P. & Wang Y. Hedgehog Signaling: From Basic Biology to Cancer Therapy. Cell Chem. Biol. 24, 252–280 (2017). - PMC - PubMed
    1. Atwood S. X. et al. Smoothened Variants Explain the Majority of Drug Resistance in Basal Cell Carcinoma. Cancer Cell 27, 342–353 (2015). - PMC - PubMed
    1. Gong X. et al. Structural basis for the recognition of Sonic Hedgehog by human Patched1. Science 361, eaas8935 (2018). - PubMed

Publication types