[Preprint]. 2023 Feb 13:rs.3.rs-2532794.
doi: 10.21203/rs.3.rs-2532794/v1.

Genome-wide Association Study Meta-analysis of Blood Pressure Traits and Hypertension in Sub-Saharan African Populations: An AWI-Gen Study

Affiliations

Genome-wide Association Study Meta-analysis of Blood Pressure Traits and Hypertension in Sub-Saharan African Populations: An AWI-Gen Study

Surina Singh et al. Res Sq. .

Update in

Abstract

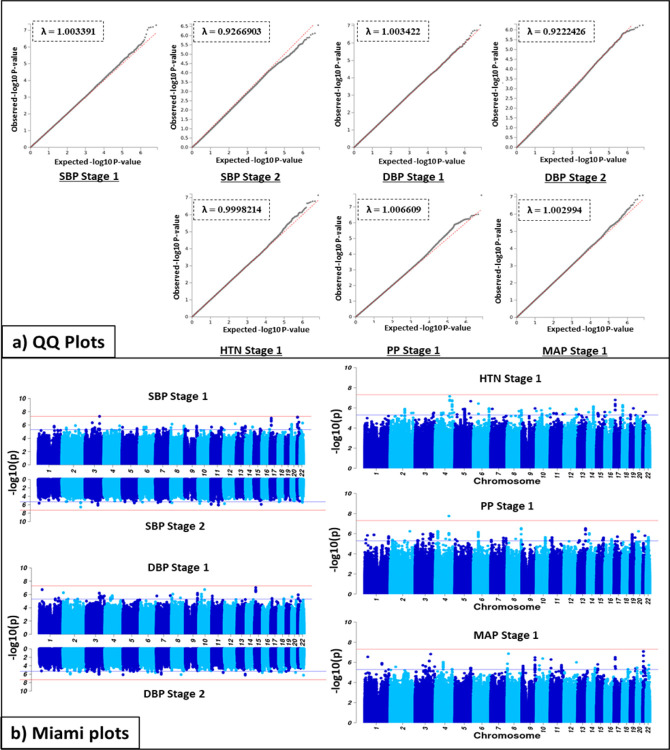
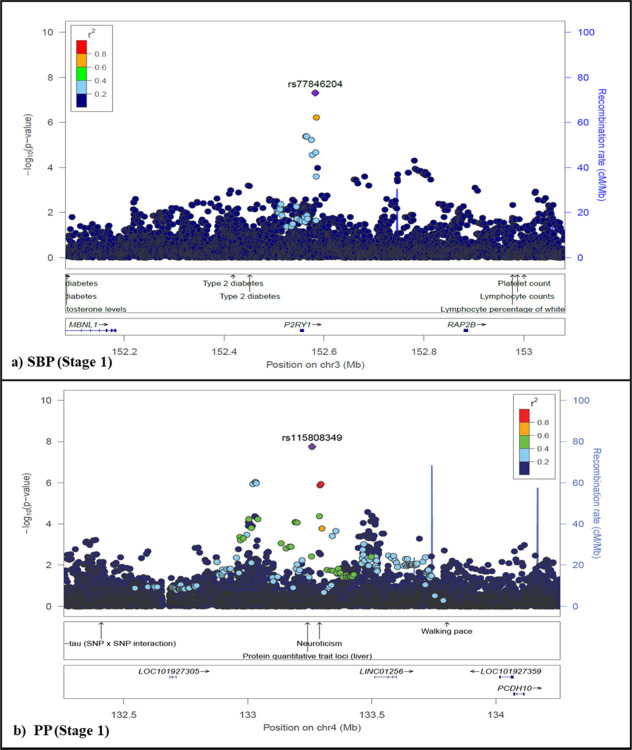
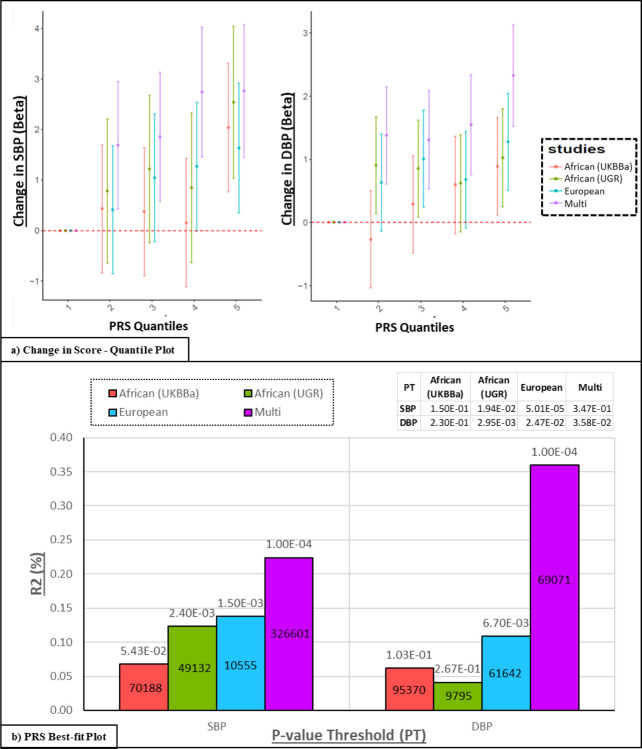
Most hypertension-related genome-wide association studies (GWAS) focus on non-African populations, despite hypertension (a major risk factor for cardiovascular disease) being highly prevalent in Africa. The AWI-Gen study GWAS meta-analysis for blood pressure-related traits (systolic and diastolic blood pressure, pulse pressure, mean-arterial pressure and hypertension) from three sub-Saharan African geographic regions (N=10,775), identified two genome-wide significant signals (p<5E-08): systolic blood pressure near P2RY1 (rs77846204; intergenic variant, p=4.25E-08) and pulse pressure near Linc01256 (rs80141533; intergenic variant, p=4.25E-08). No genome-wide signals were detected for the AWI-Gen GWAS meta-analysis with previous African-ancestry GWASs (UK Biobank (African), Uganda Genome Resource). Suggestive signals (p<5E-06) were observed for all traits, with 29 displaying pleiotropic effects and several replicating known associations. Polygenic risk scores developed from studies on different ancestries had limited transferability, with multi-ancestry models providing better prediction. This study provides insights into the genetics and physiology of blood pressure variation in African populations.


Conflict of interest statement

Conflict of interest The authors declare that the research was conducted in the absence of any commercial or financial relationships that could be construed as a potential conflict of interest.

Figures

Figure 1
Figure 1. Workflow summary for datasets and analyses.
Stage 1 GWAS conducted for all five BP-related traits i.e. a meta-analysis of each AWI-Gen region (East, South, West) per trait – sample sizes are indicated in brackets. Stage 2 GWAS conducted for SBP and DBP i.e. a meta-analysis of the Stage 1 results with other African-ancestry summary statistics i.e. UGR and UKBB. Replication of associations were assessed using the GWAS Catalog, PhenoScanner and other studies summary statistics,. Transferability across studies was conducted via PRS models based on African-ancestry (UGR, UKBBa), Multi-ancestry i.e. PAGE and European-ancestry i.e. UKBB & ICPBP cohorts (discovery) used to assess the distribution of SBP and DBP risk according to PRS deciles in the AWI-Gen cohort (target).
Figure 2
Figure 2
Discovery GWAS genetic associations in AWI-Gen (Stage 1) and the meta-analysis (Stage 2) showed by (a) Q-Q plots with the genomic control coefficient (λ) and (b) Miami plots for five BP traits. Adjusting for age, age2, sex and the first 10 PCs as covariates. With GW significance = p < 5E-8. QQ-plot shows the distribution of −log10-transformed p-value for observed (y-axis) vs expected (x-axis) with GIF (λ); red line = observed; grey line = expected. Miami plot shows −log10-transformed two-tailed p-value for each BP trait (y-axis) and base pair positions along the chromosomes (x-axis); red line = GW significance (p < 5E-08); purple line = threshold for suggestive association (p <1E-06).
Figure 3
Figure 3
Fine mapping of novel GW significant (p < 5E-08) associations for BP-related traits in the AWI-Gen study. Locuszoom plots showing association for GW significant associations. Lead SNPs (purple diamond), GWAS Catalog trait labels and genes are labelled. Plots shown for SBP around the P2RY1 region (rs77846204, p = 4.95E-08, intergenic RP11–38P22.2) and PP around the Linc01256 region (rs115808348, p =1.76E-08,intergenic ELL2P2 – also consisting of rs62317311 (p = 8.92E-07, ncRNA_intronic RP11–789C2.1), for the AWI-Gen Stage 1 GWAS (N =10,775).
Figure 4
Figure 4
Transferability of Polygenic Risk Score (PRS). Models derived from three ancestry GWASs (discovery) and applied to the AWI-Gen cohort (target): (1) African: Two African-ancestry cohorts i.e. UKBBa (n=3,058) and UGR (n = 6,400) (2) European: UK biobank and ICPBP (N = 757,601), and (3) Multi-ancestry: PAGE (N = 49,839 with 17,152 African-ancestry) cohort,. a) PRS stratification of SBP and DBP: Point range-plots comparing the difference in BP-trait mean (mmHg) of the upper PRS quintiles from the lowest, stratified by the discovery datasets (error bars = mean ± 95% confidence intervals) are shown. b Plots showing additional variance explained (% R2) by each PRS for SBP and DBP: P-value (above bar) and number of SNPs (within bar) are stated for the P-threshold value (PT).

References

    1. Kjeldsen S. E. Hypertension and cardiovascular risk: General aspects. Pharmacological research 129, 95–99 (2018). - PubMed
    1. Fuchs F. D. & Whelton P. K. High blood pressure and cardiovascular disease. Hypertension 75, 285–292 (2020). - PMC - PubMed
    1. WHO. World health statistics 2022: monitoring health for the SDGs, sustainable development goals. (2022).
    1. Kurniansyah N. et al. A multi-ethnic polygenic risk score is associated with hypertension prevalence and progression throughout adulthood. Nature communications 13, 1–13 (2022). - PMC - PubMed
    1. Kearney P. M. et al. Global burden of hypertension: analysis of worldwide data. The lancet 365, 217–223 (2005). - PubMed

Publication types

LinkOut - more resources