[Preprint]. 2023 Feb 17:2023.02.15.528699.
doi: 10.1101/2023.02.15.528699.

Vacuum Insulated Probe Heated ElectroSpray Ionization source (VIP-HESI) enhances micro flow rate chromatography signals in the Bruker timsTOF mass spectrometer

Affiliations

Vacuum Insulated Probe Heated ElectroSpray Ionization source (VIP-HESI) enhances micro flow rate chromatography signals in the Bruker timsTOF mass spectrometer

Mukul K Midha et al. bioRxiv. .

Update in

Abstract

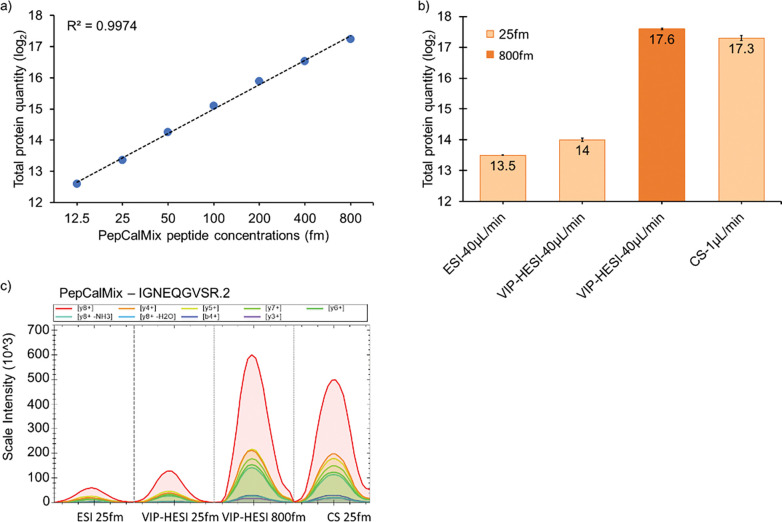
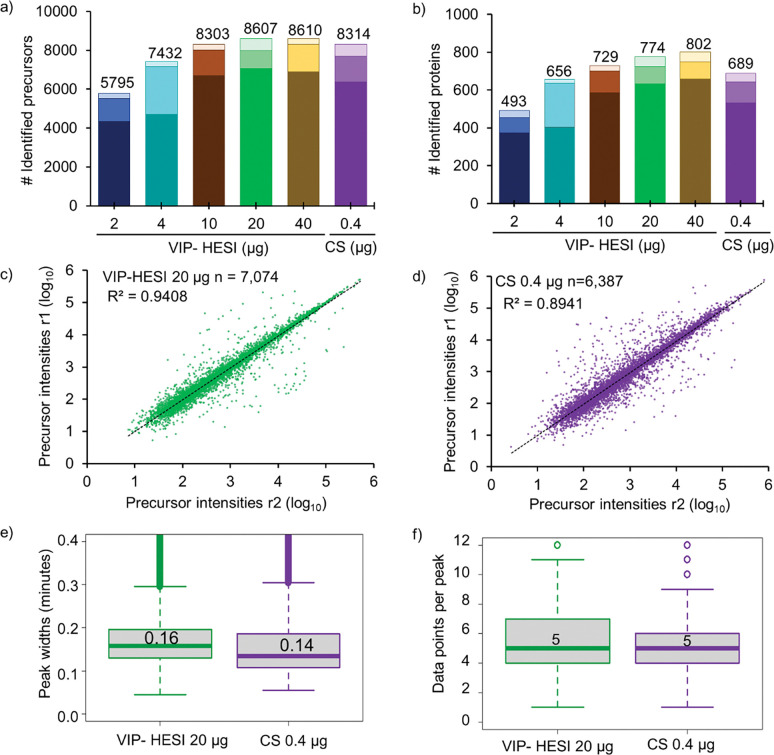
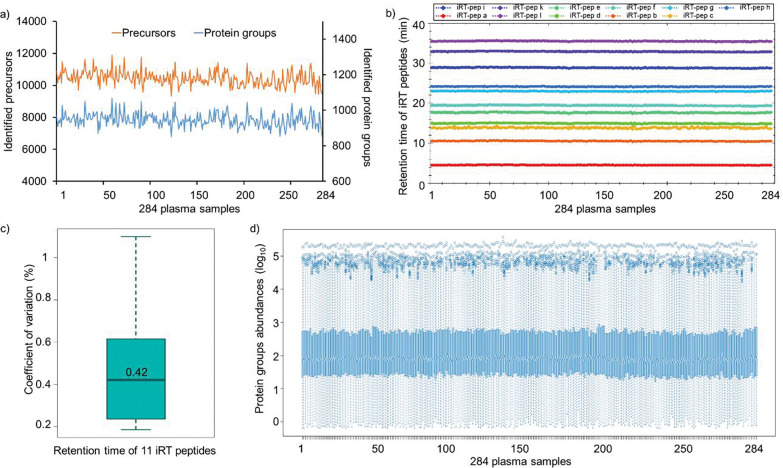
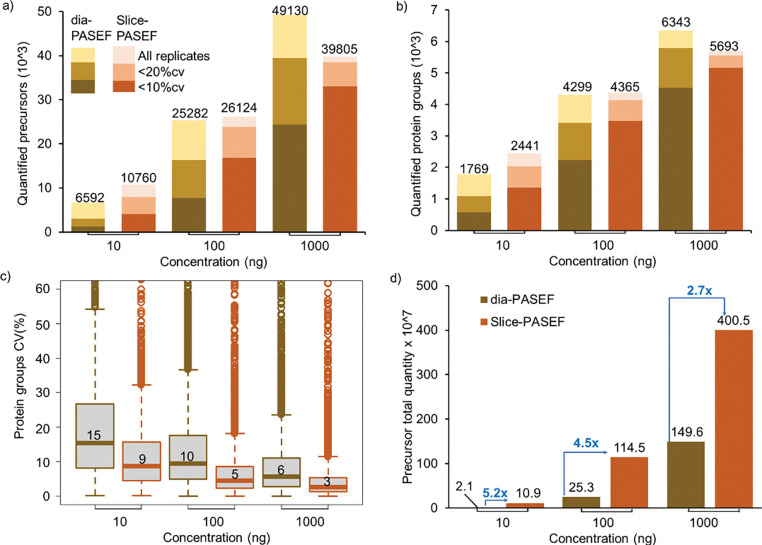
By far the largest contribution to ion detectability in liquid chromatography-driven mass spectrometry-based proteomics is the efficient generation of peptide ions by the electrospray source. To maximize the transfer of peptides from liquid to a gaseous phase to allow molecular ions to enter the mass spectrometer at micro-spray flow rates, an efficient electrospray process is required. Here we describe superior performance of new Vacuum-Insulated-Probe-Heated-ElectroSpray-Ionization source (VIP-HESI) coupled with micro-spray flow rate chromatography and Bruker timsTOF PRO mass spectrometer. VIP-HESI significantly improves chromatography signals in comparison to nano-spray ionization using the CaptiveSpray source and provides increased protein detection with higher quantitative precision, enhancing reproducibility of sample injection amounts. Protein quantitation of human K562 lymphoblast samples displayed excellent chromatographic retention time reproducibility (<10% coefficient-of-variation (CV)) with no signal degradation over extended periods of time, and a mouse plasma proteome analysis identified 12% more plasma protein groups allowing large-scale analysis to proceed with confidence (1,267 proteins at 0.4% CV). We show that Slice-PASEF mode with VIP-HESI setup is sensitive in identifying low amounts of peptide without losing quantitative precision. We demonstrate that VIP-HESI coupled with micro-flow-rate chromatography achieves higher depth of coverage and run-to-run reproducibility for a broad range of proteomic applications.


Conflict of interest statement

Ethics declarations

The authors declare no competing interests.

Figures

Figure 1.
Figure 1.. Evaluation of the linearity and sensitivity comparison of VIP-HESI, ESI, and CS ion source setups using PepCalMix measurements.
a) Line graph of PepCalMix peptides to assess the linearity measured by dia-PASEF mode in timsTOF mass spectrometer. b) Bar plots of total quantities of all 20 PepCalMix peptides observed with ESI, CS ion sources at 25 fmol injection amount at 40 μL /min and 1 μL /min respectively, and with VIP-HESI source at 25 & 800 fmol injection amounts at 40 μL /min. Keeping the concentration of the eluting peak height constant (25 fmol for 1 μL = CS, 800 fmol for 40 μL for VIP-HESI), the response of VIP-HESI is even increased by 30% and a slightly higher peak response using the VIP-HESI source is observed. The error bars indicate the variability within three replicates represented as the standard error of the mean at the log2 scale. These are calculated as the ratio of the standard deviation of the peptide intensities observed with each source setup replicate to the square root of the sample size (n = 3). c) Extracted Ion Chromatogram (XIC) plots of a single precursor IGNEQGVSR.2 representing each source setup, colored by MS2 fragment intensity observed per measurement, as per the injection amount and flow rates.
Figure 2.
Figure 2.. Comparative performance assessment of VIP-HESI and CS ion source setups using different injection amounts of undepleted mouse plasma samples.
a) Number of precursors and b) protein groups identified with different injection amounts of mouse plasma samples analyzed in duplicate with a 45-minute 40μl/min microflow gradient. The darker color bar represents common identification between the replicates whereas the two lighter color bars at the top represents exclusive precursors and proteins identified in each biological replicate at the different concentration measurements. Pearson correlation of precursor intensity values obtained from 7,074 and 6,387 precursors that were quantified in both replicates (r1 and r2) using c) VIP-HESI and d) CS source setups respectively. e) Distribution of the base peak widths in minutes of precursors identified for VIP-HESI 20 μg and CS 0.4 μg measurements estimated by Spectronaut. A median value of 0.16 (9.6s) and 0.14 (8.4s) peak widths were observed for VIP-HESI 20 μg and CS 0.4 μg injections, respectively. The first and third quartiles are marked by a box with a whisker marking a minimum/maximum value ranging to 0.6 interquartile and the median is depicted as a solid line. f) Distribution of data points per elution peak for the VIP-HESI 20 μg and CS 0.4 μg measurements estimated by Spectronaut. The first and third quartiles are marked by a box with a whisker marking a minimum/maximum value ranging to 3 interquartile and the median is depicted as a solid line.
Figure 3.
Figure 3.. Large-scale quantitative analysis of undepleted mouse plasma samples using VIP-HESI coupled with microflow LC–MS/MS system.
a) Number of precursors (orange) and protein groups (blue) quantified with 284 mouse plasma samples analyzed in a 45-minute 40μl/min microflow gradient on Vanquish Neo HPLC coupled to Bruker timsTOF Pro. b) A retention time QC plot for 11 iRT peptides spiked in each sample. c) Distribution of coefficient of variation (CV) in retention time of iRT peptides across 284 samples and the median is depicted as a solid line. d) Distribution plot of raw (un-normalized) protein quantities estimated in dia-PASEF analysis for 284 undepleted mouse plasma samples. Log10 protein quantities are plotted on the y-axis, sample number on the x-axis. Overall, protein quantities were similar across all samples with good alignment of sample medians and distributions over the first and third quartiles.
Figure 4.
Figure 4.. Performance of VIP-HESI-microflow setup with low sample amounts measured using dia-PASEF and Slice-PASEF acquisition methods.
a) The number of precursors and b) protein groups quantified with different injection amounts of a HeLa tryptic digest analyzed in triplicates with a 21-minute 20μL/min microflow gradient on Vanquish Neo HPLC coupled to Bruker timsTOF Pro. The precursors and protein groups that were observed in all three replicates of each measurement were represented as all replicates and quantification precision expressed as coefficient of variation (CV) are illustrated at 10% and 20% levels. The Slice-PASEF method outperformed the dia-PASEF method in a 10ng sample amount by quantifying more precursors and proteins at both 10% and 20% CV levels. c) Distribution of the coefficient of variation (CV) of protein groups identified in all three replicates of different measurements at 1% protein FDR estimated by DIA-NN. The first and third quartiles are marked by a box with a whisker marking a minimum/maximum value ranging to 18 interquartile and the median is depicted as a solid line. d) The total quantity of all precursors identified in each measurement estimated by DIA-NN. The signal boost in the total quantity of all precursors between the same injection amounts is marked by the blue-colored arrows. The maximum boost is observed in the lowest sample amount of 10ng measurements using the Slice-PASEF method.

References

    1. Bian Y.; Zheng R.; Bayer F. P.; Wong C.; Chang Y. C.; Meng C.; Zolg D. P.; Reinecke M.; Zecha J.; Wiechmann S.; et al. Robust, Reproducible and Quantitative Analysis of Thousands of Proteomes by Micro-Flow LC–MS/MS. Nat. Commun. 2020, 11 (1), 1–12. 10.1038/s41467-019-13973-x. - DOI - PMC - PubMed
    1. Vowinckel J.; Zelezniak A.; Bruderer R.; Mülleder M.; Reiter L.; Ralser M. Cost-Effective Generation of Precise Label-Free Quantitative Proteomes in High-Throughput by MicroLC and Data-Independent Acquisition. Sci. Rep. 2018, 8 (1), 1–10. 10.1038/s41598-018-22610-4. - DOI - PMC - PubMed
    1. Sun R.; Hunter C.; Chen C.; Ge W.; Morrice N.; Liang S.; Zhu T.; Yuan C.; Ruan G.; Zhang Q.; et al. Accelerated Protein Biomarker Discovery from FFPE Tissue Samples Using Single-Shot, Short Gradient Microflow SWATH MS. J. Proteome Res. 2020. 10.1021/acs.jproteome.9b00671. - DOI - PubMed
    1. Kuster B.; Bian Y.; Bayer F. P.; Chang Y. C.; Meng C.; Hoefer S.; Deng N.; Zheng R.; Boychenko O. Robust Microflow LC-MS/MS for Proteome Analysis: 38 000 Runs and Counting. Anal. Chem. 2021, 93 (8), 3686–3690. 10.1021/acs.analchem.1c00257. - DOI - PMC - PubMed
    1. Gao H.; Liu Y.; Demichev V.; Tate S.; Chen C.; Zhu J.; Lu C.; Ralser M.; Guo T.; Zhu Y. Optimization of Microflow LC Coupled with Scanning SWATH and Its Application in Hepatocellular Carcinoma Tissues. J. Proteome Res. 2022, 21 (7), 1686–1693. 10.1021/acs.jproteome.2c00078. - DOI - PubMed

Publication types