[Preprint]. 2023 Feb 18:2023.02.17.528937.
doi: 10.1101/2023.02.17.528937.

Ketogenic diet promotes tumor ferroptosis but induces relative corticosterone deficiency that accelerates cachexia

Affiliations

Ketogenic diet promotes tumor ferroptosis but induces relative corticosterone deficiency that accelerates cachexia

Miriam Ferrer et al. bioRxiv. .

Update in

Abstract

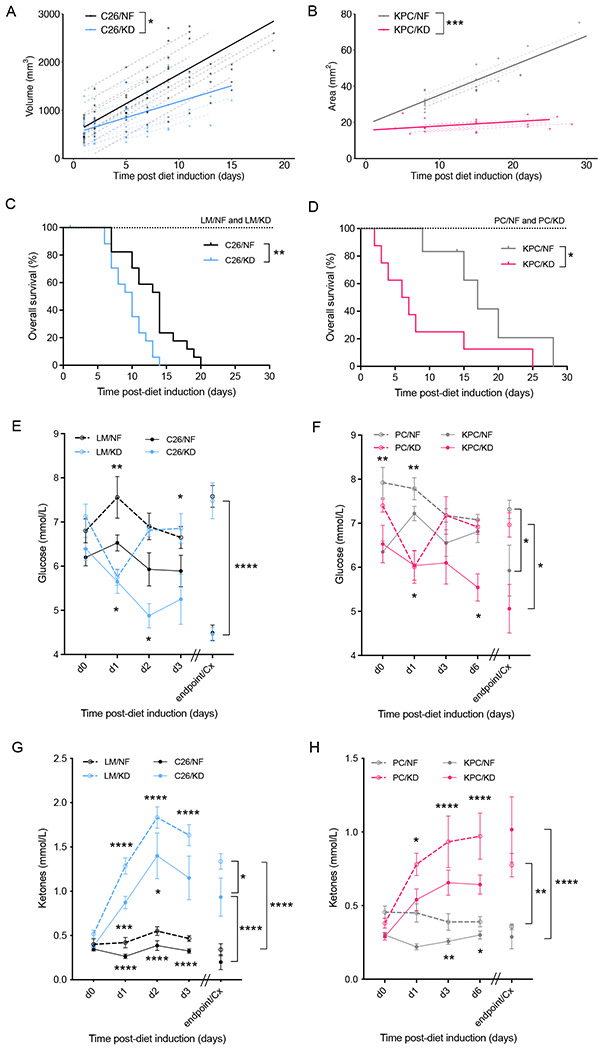
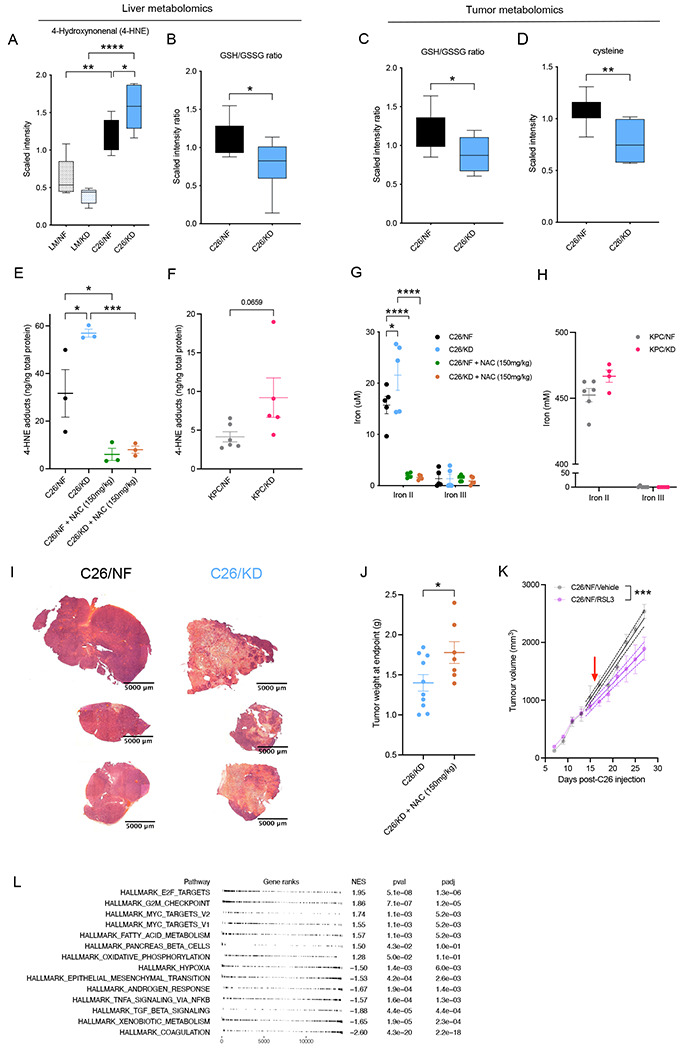
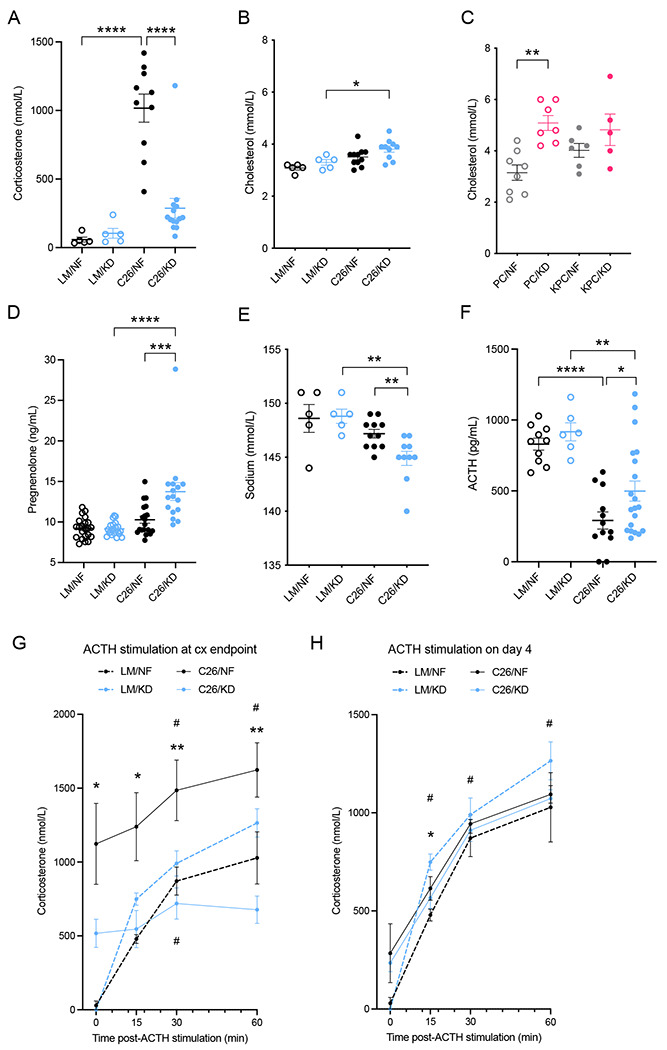
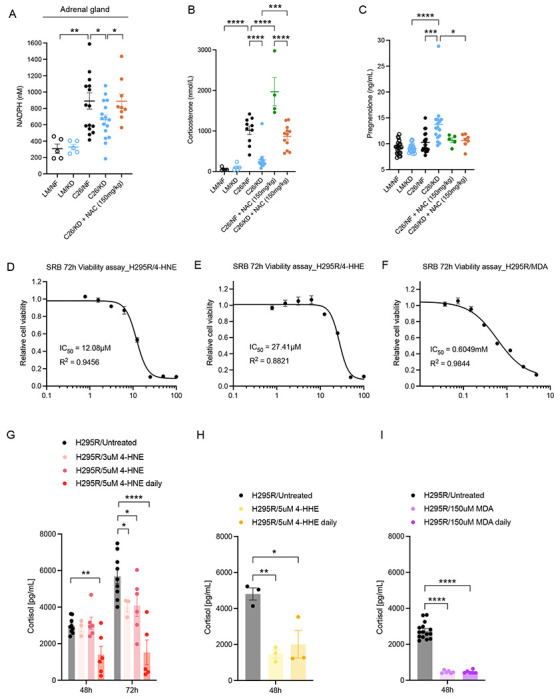
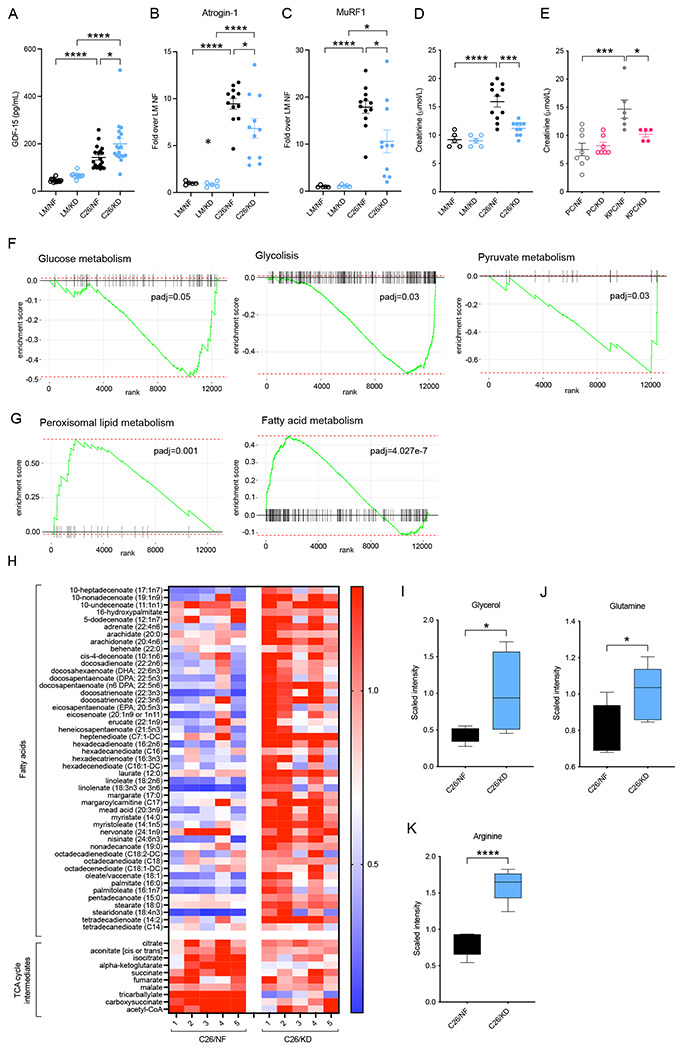
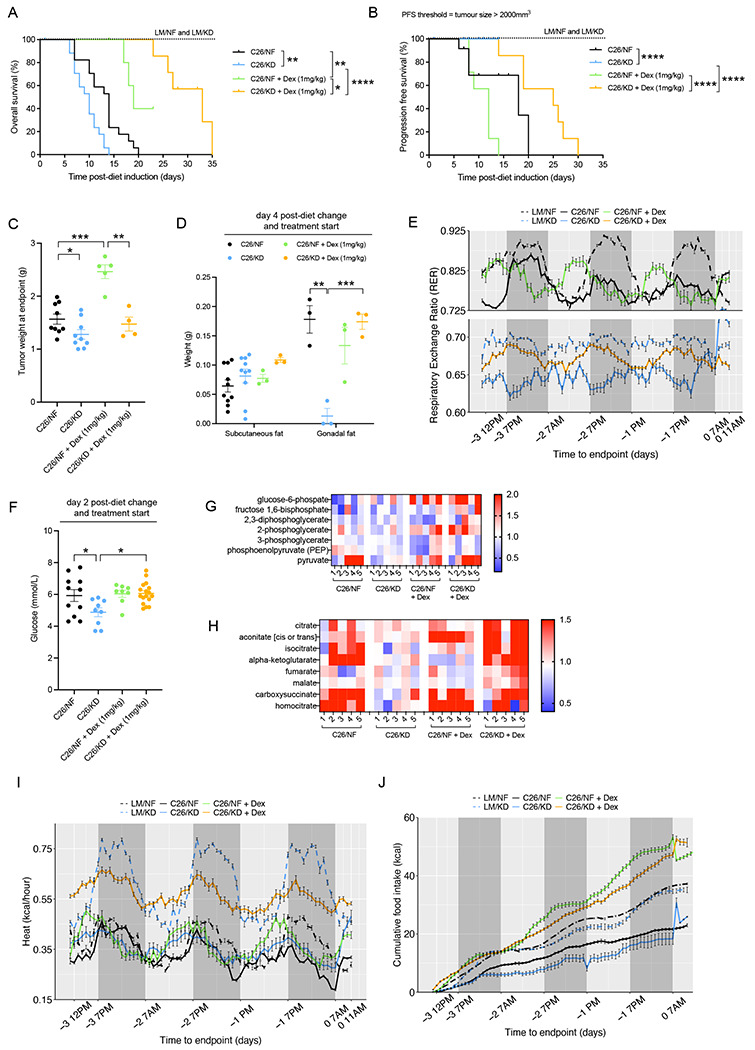
The dependency of cancer cells on glucose can be targeted with high-fat low-carbohydrate ketogenic diet (KD). However, hepatic ketogenesis is suppressed in IL-6 producing cancers, which prevents the utilization of this nutrient source as energy for the organism. In two IL-6 associated murine models of cancer cachexia we describe delayed tumor growth but accelerated onset of cancer cachexia and shortened survival when mice are fed KD. Mechanistically, we find this uncoupling is a consequence of the biochemical interaction of two simultaneously occurring NADPH-dependent pathways. Within the tumor, increased production of lipid peroxidation products (LPPs) and, consequently, saturation of the glutathione (GSH) system leads to ferroptotic death of cancer cells. Systemically, redox imbalance and NADPH depletion impairs the biosynthesis of corticosterone, the main regulator of metabolic stress, in the adrenal glands. Administration of dexamethasone, a potent glucocorticoid, improves food intake, normalizes glucose homeostasis and utilization of nutritional substrates, delays onset of cancer cachexia and extends survival of tumor-bearing mice fed KD, while preserving reduced tumor growth. Our study highlights that the outcome of systemic interventions cannot necessarily be extrapolated from the effect on the tumor alone, but that they have to be investigated for anti-cancer and host effects. These findings may be relevant to clinical research efforts that investigate nutritional interventions such as KD in patients with cancer.


Conflict of interest statement

DECLARATION OF INTERESTS

The authors declare no competing interests.

Figures

Figure 1.
Figure 1.. Ketogenic diet slows down tumor growth but shortens overall survival in C26 and KPC murine models of cancer cachexia.
(A) Longitudinal tumor volume in C26 tumor-bearing mice fed ketogenic (KD) or standard (NF) diets (n=12). (B) Longitudinal tumor area in KPC tumor-bearing mice fed KD or NF (n=8). (C) Overall survival of C26 tumor-bearing mice and littermate controls on KD or NF (n=7 LM, n=17-18 C26). (D) Overall survival of KPC tumor-bearing mice and PC controls fed KD or NF (n=6-8). (E-F) Longitudinal glucose measurements from day 0 of diet change to cachectic endpoint in C26 tumor-bearing mice and littermate controls (n=5 LM, n=20 C26) (E), and in KPC tumor-bearing mice and PC controls (n=10) (F), fed either KD or NF diets. (G-H) Longitudinal ketone measurements from day 0 of diet change of cachectic endpoint in C26 tumor-bearing mice and littermate controls (n=5 LM, n=20 C26) (G), and in KPC tumor-bearing mice and PC controls (n=10) (H), fed either KD or NF diets. Data are expressed as the mean ± SEM. Overall survival (OS): time until mice reach >15% bodyweight loss. Differences in (A-B) were assessed by fitting a mixed effect model with coefficients for the intercept, slope and the difference in the slope between diets, and a random component for each individual mouse. Kaplan–Meier curves in (C-D) were statistically analyzed by using the log-rank (Mantel–Cox) test. Two-way ANOVA statistical tests with Tukey’s correction for post hoc comparisons were performed in (E-H). * p-value < 0.05, ** p-value < 0.01, *** p-value < 0.001, **** p-value < 0.0001.
Figure 2.
Figure 2.. Ketogenic diet induces ferroptotic cell death of cancer cells that can be prevented by NAC.
(A-B) Quantification by UPLC-MS/MS of 4-hydroxynonenal (4-HNE) and GSH/GSSG ratio (B) in the liver of C26-tumor bearing and littermate controls on KD or NF diets (n=7). (C-D) Quantification by UPLC-MS/MS of GSH/GSSG ratio (C) and cysteine (D) in the tumor of C26 mice (n=7). (E) Detection of 4-HNE adducts in tumor lysates from C26 tumor-bearing mice untreated or treated with N-acetyl cysteine (NAC) and fed KD or NF (n=3). (F) 4-HNE adducts formation in tumor of KPC mice fed KD or NF (n=4-6). (G-H) Concentration of ferric (III) and ferrous (II) iron in the tumor of C26 mice fed KD or NF, untreated or treated with NAC intraperitoneally (n=5) (G), and in tumors of KPC mice fed either diet (n=6) (H). (I) Haematoxylin and eosin (H&E) staining of tumors from C26 mice fed KD or NF. (J) Weight of tumors at the time of cachexia in C26 tumor-bearing mice fed KD untreated or treated with NAC (n=7-10). (K) Longitudinal tumor volume of C26 mice fed standard diet and treated with RSL3 or vehicle control (n=4-6). (L) GSEA of upregulated and downregulated pathways in tumors of KPC mice fed KD compared to KPC fed NF (n=5). Data are expressed as the mean ± SEM. One-way ANOVA with Tukey’s correction for post hoc testing was used in (A, E-G). Statistical differences in (B-D, H-I) were examined using an unpaired two-tailed Student’s t-test with Welch’s correction. Simple linear regression model was applied to (J). Statistical analysis in (K) is described in Methods. * p-value < 0.05, ** p-value < 0.01, *** p-value < 0.001, **** p-value < 0.0001.
Figure 3.
Figure 3.. Ketogenic diet induces relative corticosterone deficiency in C26-tumor bearing mice.
(A) Corticosterone hormone levels in plasma of cachectic C26 tumor-bearing mice and littermate controls fed KD or NF diets (n=5 LM, n=10-14 C26). (B-C) Plasma cholesterol levels in cachectic C26-tumor bearing mice and littermate controls (n=5 LM, n=10-11 C26) (B), and in cachectic KPC tumor-bearing mice and PC controls (n=5-8) (C) fed KD or NF diet. (D) Pregnenolone hormone levels in plasma of cachectic C26 tumor-bearing mice and littermate controls on KD or NF diets (n=16-22). (E) Sodium levels in plasma of cachectic C26-tumor bearing mice and littermate controls on KD or NF diets (n=5 LM, n=10-11 C26). (F) Levels of adrenocorticotropic hormone (ACTH) in plasma of cachectic C26 tumor-bearing mice and littermate controls fed KD or NF (n=6-10 LM, n=12-20 C26). (G-H) Synacthen test and quantification of corticosterone response at baseline and 15, 30 and 60 minutes after ACTH stimulation in cachectic C26 tumor-bearing mice and littermate controls (endpoint) (G), or only 4 days after diet change (18 days after C26 cell injection) (n=5) (H). Data are expressed as the mean ± SEM. One-way ANOVA with Tukey’s correction for post hoc testing was used in (A-D, F). Two-way ANOVA statistical tests with Tukey’s correction for post hoc comparisons were performed in (G-H). * p-value < 0.05, ** p-value < 0.01, *** p-value < 0.001, **** p-value < 0.0001, # p-value < 0.05 compared to time = 0.
Figure 4.
Figure 4.. Effect of lipid peroxidation products (LPPs) on adrenal function and rescue with NAC.
(A) NADPH quantification in the adrenal glands of littermate controls and C26 tumor-bearing mice fed KD or IMF, and C26 tumor-bearing mice fed KD treated with NAC (n=5 LM, n=9-11 C26). (B-C) Corticosterone (n=5 LM, n=10-14 C26) (B) and pregnenolone (n=5-22) (C) levels in plasma of littermate controls and C26 tumor-bearing mice fed KD or NF, untreated or treated with NAC. (D-F) SRB assays of H295R cells treated for 72h with increasing concentrations of 4-HNE (D), 4-HHE (E) or MDA (F) (n=3 independent experiments). Viability is expressed relative to vehicle-treated control cells. (G-I) Cortisol levels in the media of H295R cells treated with 4-FINE (n=3-6) (G), 4-HHE (n=3-6) and MDA (n=6-15) (I) at 48h and 72h timepoints. Data are expressed as the mean ± SEM. One-way ANOVA with Tukey’s correction for post hoc testing was used in (A-C, G-I). * p-value < 0.05, *** p-value < 0.001, **** p-value < 0.0001.
Figure 5.
Figure 5.. Appropriate usage of energy sources in the context of cachexia is impaired in KD-fed tumor-bearing mice.
(A) Levels of GDF-15 in the plasma of C26 tumor-bearing mice and littermate controls fed KD or NF (n=11-19). (B-C) mRNA levels of the E3 ligases Atrogin-1 (B) and MuRF1 (C) in the quadriceps of C26 tumor-bearing mice and littermate controls fed KD or NF (n=5 LM, n=12 C26). (D-E) Plasma creatinine levels in C26 tumor-bearing mice and littermate controls (n=5 LM, n=9-11 C26) (D), and KPC tumor-bearing mice and PC controls (n=5-8) (E) fed either KD or NF. (F-G) GSEA analysis of downregulated (F) and upregulated (G) pathways in KD-fed C26 tumor-bearing mice compared to those NF-fed (n=5). (H) Heatmap of metabolites and specific metabolic pathways in C26 tumor-bearing mice fed KD or NF (n=5). (I-K) Quantification by UPLC-MS/MS of the main substrates of the TCA cycle, glycerol (I), glutamine (J), and arginine (K) in the tumor of C26 mice fed KD or NF (n=7). Data are expressed as the mean ± SEM. One-way ANOVA with Tukey’s correction for post hoc testing was used in (A-E). Statistical analysis in (F-G) is described in Methods. Statistical differences in (I-K) were examined using an unpaired two-tailed Student’s t-test with Welch’s correction. * p-value < 0.05, *** p-value < 0.001, **** p-value < 0.0001.
Figure 6.
Figure 6.. Dexamethasone treatment extends survival and improves metabolic adaptation of C26 mice fed ketogenic diet.
(A-B) Overall survival (OS) (A) and Progression Free survival (PFS) (B) of C26 tumor-bearing mice fed KD or NF, untreated or treated with Dexamethasone, and littermate controls fed with either diet (n=7 LM, n=17-18 C26, n=7 C26 + Dex). (C) Weight of tumors in C26 tumor-bearing mice fed KD or NF, untreated or treated with Dexamethasone, at endpoint (n=9-10 C26, n=4-5 C26 + Dex). (D) Quantification of subcutaneous and gonadal fat stores in C26-tumor bearing mice fed KD or NF, untreated or treated with Dexamethasone, 4 days after diet change and start of treatment (n=3-10). (E) Cumulative food intake (kcal) during the last 4 days before endpoint in littermate controls and C26 tumor-bearing mice, untreated or treated with Dexamethasone, fed KD or NF (n=7). (F) Plasma glucose levels in C26-tumor bearing mice fed KD or NF, untreated or treated with Dexamethasone, 2 days after diet change and start of treatment. (G-H) Quantification by UPLC-MS/MS of metabolites involved in gluconeogenesis (G) and the TCA cycle (H) in the liver of C26 tumor-bearing mice on either KD or NF diets, untreated or treated with Dexamethasone (n=5). (I-J) Respiratory exchange ratio (RER) (I) and Heat (or energy expenditure) (J) during the last 4 days before endpoint in littermate controls and C26 tumor-bearing mice, untreated or treated with Dexamethasone, fed KD or NF. Data are expressed as the mean ± SEM. . Overall survival (OS): time until mice reach >15% bodyweight loss. Progression-Free Survival (PFS): time until tumor size reaches > 2000 mm3. Kaplan–Meier curves in (A-B) were statistically analyzed by using the log-rank (Mantel-Cox) test. One-way ANOVA with Tukey’s correction for post hoc testing was used in (C-D, F) Analysis in (E, G-J) is described in Methods. * p-value < 0.05, ** p-value < 0.01, *** p-value < 0.001, **** p-value < 0.0001.

References

    1. Alborzinia Hamed, Flórez Andrés F., Kreth Sina, Brückner Lena M., Yildiz Umut, Gartlgruber Moritz, Odoni Dorett I., Poschet Gemot, Garbowicz Karolina, Shao Chunxuan, Klein Corinna, Meier Jasmin, Zeisberger Petra, Nadler-Holly Michal, Ziehm Matthias, Paul Franziska, Burhenne Jürgen, Bell Emma, Shaikhkarami Marjan, Würth Roberto, Stainczyk Sabine A., Wecht Elisa M., Kreth Jochen, Büttner Michael, Ishaque Naveed, Schlesner Matthias, Nicke Barbara, Stresemann Carlo, Llamazares-Prada María, Reiling Jan H., Fischer Matthias, Amit Ido, Selbach Matthias, Herrmann Carl, Wölfl Stefan, Henrich Kai Oliver, Höfer Thomas, Trumpp Andreas, and Westermann Frank. 2022. “MYCN Mediates Cysteine Addiction and Sensitizes Neuroblastoma to Ferroptosis.” Nature Cancer 3(4):471–85. - PMC - PubMed
    1. Anderson Nicole M., Mucka Patrick, Kern Joseph G., and Feng Hui. 2018. “The Emerging Role and Targetability of the TCA Cycle in Cancer Metabolism.” Protein and Cell 9(2):216–37. - PMC - PubMed
    1. Arbour Kathryn C., Mezquita Laura, Long Niamh, Rizvi Hira, Auclin Edouard, Ni Andy, Martínez-Bernal Gala, Ferrara Roberto, Lai W. Victoria, Hendriks Lizza E. L., Sabari Joshua K., Caramella Caroline, Plodkowski Andrew J., Halpenny Darragh, Chaft Jamie E., Planchard David, Riely Gregory J., Besse Benjamin, and Hellmann Matthew D.. 2018. “Impact of Baseline Steroids on Efficacy of Programmed Cell Death-1 and Programmed Death-Ligand 1 Blockade in Patients with Non–Small–Cell Lung Cancer.” Journal of Clinical Oncology 36(28):2872–78. - PubMed
    1. Badgley Michael A., Kremer Daniel M., Maurer H. Carlo, DelGiorno Kathleen E., Lee Ho Joon, Purohit Vinee, Sagalovskiy Irina R., Ma Alice, Kapilian Jonathan, Firl Christina E. M., Decker Amanda R., Sastra Steve A., Palermo Carmine F., Andrade Leonardo R., Sajjakulnukit Peter, Zhang Li, Tolstyka Zachary P., Hirschhorn Tal, Lamb Candice, Liu Tong, Gu Wei, Seeley E. Scott, Stone Everett, Georgiou George, Manor Uri, luga Alina, Wahl Geoffrey M., Stockwell Brent R., Lyssiotis Costas A., and Olive Kenneth P.. 2020. “Cysteine Depletion Induces Pancreatic Tumor Ferroptosis in Mice.” Science 368(6486):85–89. - PMC - PubMed
    1. Betancourt Angelica, Busquets Sílvia, Ponce Marta, Toledo Míriam, Guàrdia-Olmos Joan, Peró-Cebollero Maribel, López-Soriano Francisco J., and Argilés Josep M.. 2019. “The Animal Cachexia Score (ACASCO).” Animal Models and Experimental Medicine 2(3):201–9. - PMC - PubMed

Publication types