[Preprint]. 2023 Feb 15:2023.01.02.522500.
doi: 10.1101/2023.01.02.522500.

The Embryonic Origin of Primordial Germ Cells in the Tardigrade Hypsibius exemplaris

Affiliations

The Embryonic Origin of Primordial Germ Cells in the Tardigrade Hypsibius exemplaris

Kira L Heikes et al. bioRxiv. .

Update in

Abstract

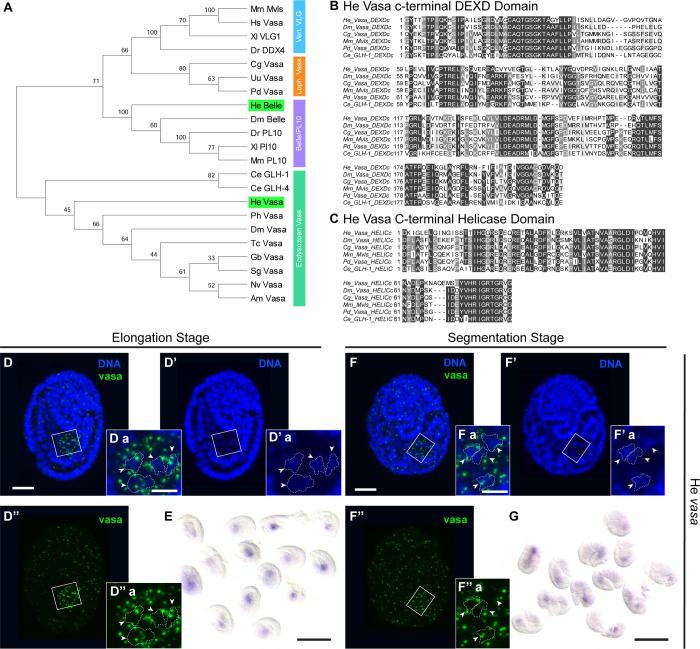
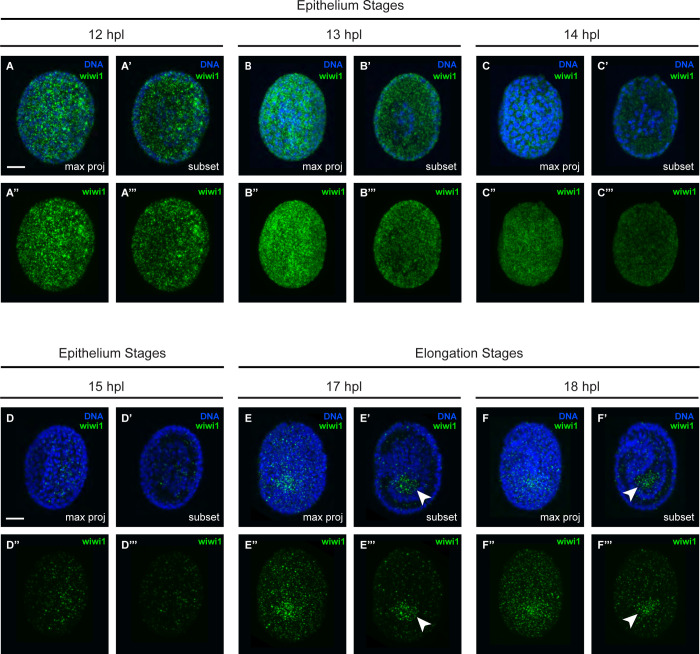
Primordial germ cells (PGCs) give rise to gametes â€" cells necessary for the propagation and fertility of diverse organisms. Current understanding of PGC development is limited to the small number of organisms whose PGCs have been identified and studied. Expanding the field to include little-studied taxa and emerging model organisms is important to understand the full breadth of the evolution of PGC development. In the phylum Tardigrada, no early cell lineages have been identified to date using molecular markers. This includes the PGC lineage. Here, we describe PGC development in the model tardigrade Hypsibius exemplaris . The four earliest-internalizing cells (EICs) exhibit PGC-like behavior and nuclear morphology. The location of the EICs is enriched for mRNAs of conserved PGC markers wiwi1 (water bear piwi 1) and vasa . At early stages, both wiwi1 and vasa mRNAs are detectable uniformly in embryos, which suggests that these mRNAs do not serve as localized determinants for PGC specification. Only later are wiwi1 and vasa enriched in the EICs. Finally, we traced the cells that give rise to the four PGCs. Our results reveal the embryonic origin of the PGCs of H. exemplaris and provide the first molecular characterization of an early cell lineage in the tardigrade phylum. We anticipate that these observations will serve as a basis for characterizing the mechanisms of PGC development in this animal.


Figures

Figure 1.
Figure 1.
The four earliest-internalizing cells migrate to the future location of the gonad and exhibit PGC-like chromatin morphology. (A) DIC images showing the four EICs at four developmental stages (EICs manually colored with transparent orange overlay, scale bar = 10 μm) and their ultimate positioning in the third trunk segment near developing midgut, evident by the presence of birefringent granules (arrow indicating a birefringent granule in A‴, approximate segment boundaries indicated by dotted lines). (B and C) DAPI-stained embryos at the segmentation stage showing the diffuse chromatin staining of cells in the position of the four EICs (each a single z plane, approximate segment boundaries indicated by dotted lines, scale bar = 10 μm). (B’ and C’) Expanded views of the boxed regions in B and C show the diffuse nature of EIC chromatin morphology (chromatin manually outlined with dotted lines and indicated by arrowheads, scale bar of enlarged region = 4 μm). Two of the four EIC nuclei are visible in the plane in B and B’, while all four EIC nuclei are visible in the slightly lower z plane in C and C’. (D and E) Position of the EICs at the segmentation stage relative to developing midgut, shown with an image of the four EICs by DIC light (D) and birefringent granules by polarized light (E), taken sequentially in a segmentation stage embryo (EICs outlined with white dotted lines and arrows indicating birefringent granules, scale bar = 10 μm).
Figure 2.
Figure 2.
wiwi1 mRNA surrounds the nuclei of the four large, undivided cells defined as the EICs. (A) Maximum-likelihood phylogenetic reconstruction of Piwi and related Argonaute amino acid sequences. Branch support out of 100 is given at each node. H. exemplaris sequences are highlighted in green. Argonaute protein families are indicated by colored bars to the right of the tree. Species name abbreviations are defined in Table 2. (B) Alignment of PIWI domain among Piwi homologs from several species. (C) Alignment of PAZ domain among Piwi homologs from several species. (D) Enrichment of wiwi1 by FISH in elongation stage embryos (18 hpl, n = 3 experiments, 5, 6, and 9 embryos, respectively, scale bar = 10 μm). (F) Enrichment of wiwi1 by FISH in segmentation stage embryos (24 hpl, n = 3 experiments, 4, 9, and 9 embryos, respectively, scale bar = 10 μm). Chromatin stained with DAPI is shown in blue, and wiwi1 mRNA staining is shown in green. (Da – D‴a and Fa – F‴a) Enlargements of boxed regions in D and F show four nuclei (outlined manually and indicated with arrowheads) overlapping with the region enriched for wiwi1 mRNAs (scale bar of enlarged region = 4 μm). (E) Widefield image of enrichment for wiwi1 by CISH in elongation stage embryos (18 hpl, n = 2 experiments, 9 and 14 embryos, respectively, scale bar = 100 μm). (G) Widefield image of enrichment for wiwi1 by CISH in segmentation stage embryos (24 hpl, n = 3 experiments, 10, 12 and 11 embryos, respectively, scale bar = 100 μm).
Figure 3.
Figure 3.
vasa mRNA surrounds the nuclei of the four large, undivided cells defined as the EICs. (A) Maximum-likelihood phylogenetic reconstruction of Vasa and related RNA helicase amino acid sequences. Branch support out of 100 is given at each node. H. exemplaris sequences are highlighted in green. RNA helicase protein families are indicated by colored bars to the right of the tree. Species name abbreviations are defined in Table 2. (B) Alignment of DEXD domain among Vasa homologs from several species. (C) Alignment of c-terminal Helicase domain among Vasa homologs from several species. (D-E) Elongation stage embryos (18 hpl). (F-G) Segmentation stage embryos (24 hpl). (D) Enrichment for vasa by FISH in elongation stage embryos (18 hpl, n = 3 experiments, 8, 9, and 9 embryos, respectively, scale bar = 10 μm). (F) Enrichment for vasa by FISH in segmentation stage embryos (24 hpl, n = 1 experiment, 9 embryos, scale bar = 10 μm). Chromatin stained with DAPI is shown in blue, and vasa mRNA staining is shown in green. (Da – D‴a and Fa – F‴a) Enlargements of boxed regions in D and F show four nuclei (outlined manually and indicated with arrowheads) overlapping with the region enriched for vasa mRNAs (scale bar of enlarged region = 4 μm). (E) Widefield image of enrichment for vasa by CISH in elongation stage embryos (18 hpl, n = 2 experiments, 9 and 14 embryos, respectively, scale bar = 100 μm). (G) Widefield image of enrichment for vasa by CISH in segmentation stage embryos (24 hpl, n = 2 experiments, 12 and 12 embryos, respectively, scale bar = 100 μm).
Figure 4.
Figure 4.
wiwi1 mRNA is uniformly distributed in early embryos. (A-B) One-cell stage embryos. (C-D) Two-cell stage embryos. (A) Presence of wiwi1 mRNAs by FISH in one-cell stage embryos. (C) Presence of wiwi1 mRNAs by FISH in two-cell stage embryos. (n = 2 experiments of combined one and two cell stages, 8 and 7 embryos, respectively) Since, to our knowledge, this was the first published use of this technique in early stage embryos and since embryos at this stage are so yolk-dense, we included control embryos stained for the sense probe to the wiwi1 mRNA, which showed little to no nonspecific signal. (B) Staining with wiwi1 sense negative control probes shown for one-cell stage embryos. (D) Staining with wiwi1 sense negative control probes shown for two-cell stage embryos. (n = 1 experiment of combined one and two cell stages, 6 embryos) Chromatin stained with DAPI is shown in blue, and wiwi1 mRNA staining is shown in green. Arrowheads indicate nuclei. Arrow indicates polar body, which is only sometimes maintained through the protocol. (scale bar = 10 μm)
Figure 5.
Figure 5.
vasa mRNA is uniformly distributed in early embryos. (A-B) One-cell stage embryos. (C-D) Two-cell stage embryos. (A) Presence of vasa mRNAs by FISH in one-cell stage embryos. (C) Presence of vasa mRNAs by FISH in two-cell stage embryos. (n = 1 experiments of combined one and two cell stages, 6 embryos) Since to our knowledge, this was the first published use of this technique in early stage embryos and since embryos at this stage are so yolk-dense, we included control embryos stained for the sense probe to the vasa mRNA, which showed little to no nonspecific signal. (B) Staining with vasa sense negative control probes shown for one-cell stage embryos. (D) Staining with vasa sense negative control probes shown for two-cell stage embryos. (n = 1 experiment of combined one and two cell stages, 6 embryos) Chromatin stained with DAPI is shown in blue, and vasa mRNA staining is shown in green. Arrowheads indicate nuclei. Arrows indicate polar bodies, which are only sometimes maintained through the protocol. (scale bar = 10 μm)
Figure 6.
Figure 6.
wiwi1 mRNA exhibits dynamic enrichment through development. (A-F) Enrichment of wiwi1 mRNAs through several stages of development. (A) 12 hpl (n = 2 experiments, 7 and 7 embryos, respectively). (B) 13 hpl (n = 2 experiments, 5 and 8 embryos, respectively). (C) 14 hpl (n = 2 experiments, 7 and 10 embryos, respectively). (D) 15 hpl (n = 2 experiments, 9 and 8 embryos, respectively). (E) 17 hpl (n = 2 experiments, 9 and 9 embryos, respectively). (F) 18 hpl (n = 2 experiments, 5 and 9 embryos, respectively). Maximum projections of total embryos shown on the left side for each time point and a projection of a subset of internal slices shown on the right side of each time point. Chromatin stained with DAPI is shown in blue, and wiwi1 mRNA staining is shown in green. Arrowheads indicate the region enriched for wiwi1 mRNA. (scale bars = 10 μm)
Figure 7.
Figure 7.
vasa mRNA exhibits dynamic enrichment through development. (A-F) Enrichment of vasa mRNAs through several stages of development. (A) 12 hpl (n = 2 experiments, 6 and 8 embryos, respectively). (B) 13 hpl (n = 2 experiments, 7 and 7 embryos, respectively). (C) 14 hpl (n = 2 experiments, 6 and 9 embryos, respectively). (D) 15 hpl (n = 2 experiments, 6 and 8 embryos, respectively). (E) 17 hpl (n = 2 experiments, 13 and 14 embryos, respectively). (F) 18 hpl (n = 2 experiments, 9 and 9 embryos, respectively). Maximum projections of total embryos shown on the left side for each time point and a projection of a subset of internal slices shown on the right side of each time point. Chromatin stained with DAPI is shown in blue, and vasa mRNA staining is shown in green. Arrowheads indicate the region enriched for vasa mRNA. (scale bars = 10 μm)
Figure 8.
Figure 8.
The early cell lineage of H. exemplaris reveals the embryonic origin of the PGCs. (A) Representative images of an early H. exemplaris embryo at nine timepoints: one-cell stage, first division, second division, third division, fourth division, fifth division, internalization of the EICs, sixth division, and migration of the four EICs (scale bar = 10 μm). Cells from the lineage leading to the four EICs are falsely colored with maroon and peach transparent overlays, for the anterior and posterior lineages, respectively. These overlays are shown in an outline of the embryo to the right of each image. (B) Lineage of the early H. exemplaris embryo, generated with division timing data from nine embryos, all followed from the one-cell stage through EIC migration (horizontal black bars are mean division times from 9 embryos, blue error bars indicate standard deviation from the mean). Division orientation is indicated by letters at each end of division mean time (a = anterior, p = posterior, d = dorsal, v = ventral). Axis along the right side of the lineage indicates the time of each division relative to the first division event, which was set at t = 0 for all nine embryos. Dotted arrows from A to B indicate the position of each representative image in A along the lineage. (C) Plot of internalization time (in minutes) for the four EICs relative to their sixth division, which is set at t = 0 (EICs are labeled along the horizontal axis by lineage name and with colored maroon and peach nodes, for the anterior and posterior lineages, respectively). Data is colored by embryo, and cells that internalized before undergoing the sixth division are shown at negative values above t = 0 on the inverted graph, while cells that internalized after undergoing the sixth division are shown at positive values below t = 0. Cells that were born into the middle of the embryo during the sixth division are shown at t = 0. (D) Drawing summarizing the traced embryonic origin of the PGC fate (in green) of H. exemplaris, through the stages in development observed: one-cell, two-cell, early cleavages, epithelium, elongation, segmentation, and gravid adult stages. Drawings modified from those by Heather Barber (Goldstein, 2022a), with permission.

References

    1. Aguinaldo A.M.A., Turbevillet J.M., Linford L.S., Rivera M.C., Garey:T J.R., Raff R.A., Lake J.A., 1997. Evidence for a clade of nematodes, arthropods and other moulting animals. Nature 387, 489–493. 10.1038/387489a0 - DOI - PubMed
    1. Altschul S.F., Gish W., Miller W., Myers E.W., Lipman D.J., 1990. Basic local alignment search tool. J. Mol. Biol. 215, 403–410. 10.1016/S0022-2836(05)80360-2 - DOI - PubMed
    1. Belew M.D., Chien E., Wong M., Michael W.M., 2021. A global chromatin compaction pathway that represses germline gene expression during starvation. J. Cell Biol. 220. 10.1083/jcb.202009197 - DOI - PMC - PubMed
    1. Boothby T.C., 2018. Desiccation of Hypsibius exemplaris. Cold Spring Harb. Protoc. 11, 871–873. 10.1101/pdb.prot102327 - DOI - PubMed
    1. Campanale J.P., Gökirmak T., Espinoza J.A., Oulhen N., Wessel G.M., Hamdoun A., 2014. Migration of sea urchin primordial germ cells. Dev. Dyn. 243, 917–927. 10.1002/dvdy.24133 - DOI - PMC - PubMed

Publication types