[Preprint]. 2023 Jul 17:2023.02.14.528431.
doi: 10.1101/2023.02.14.528431.

LPD-3 as a megaprotein brake for aging and insulin-mTOR signaling in C. elegans

Affiliations

LPD-3 as a megaprotein brake for aging and insulin-mTOR signaling in C. elegans

Taruna Pandey et al. bioRxiv. .

Update in

Abstract

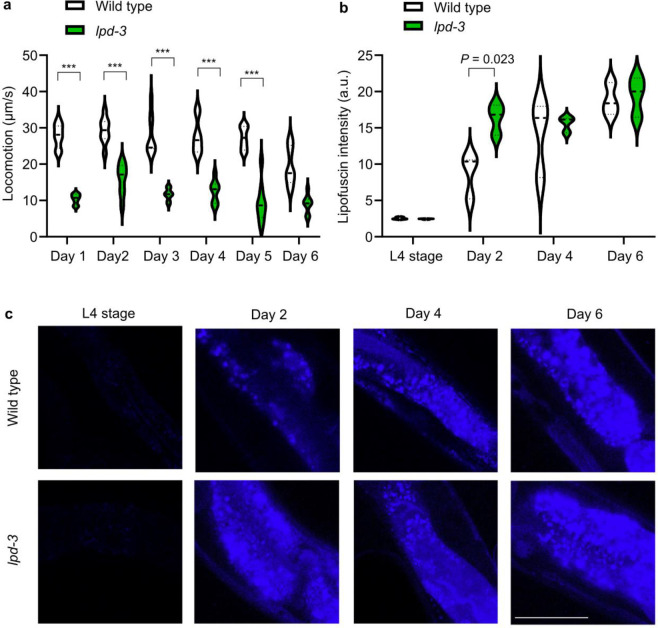
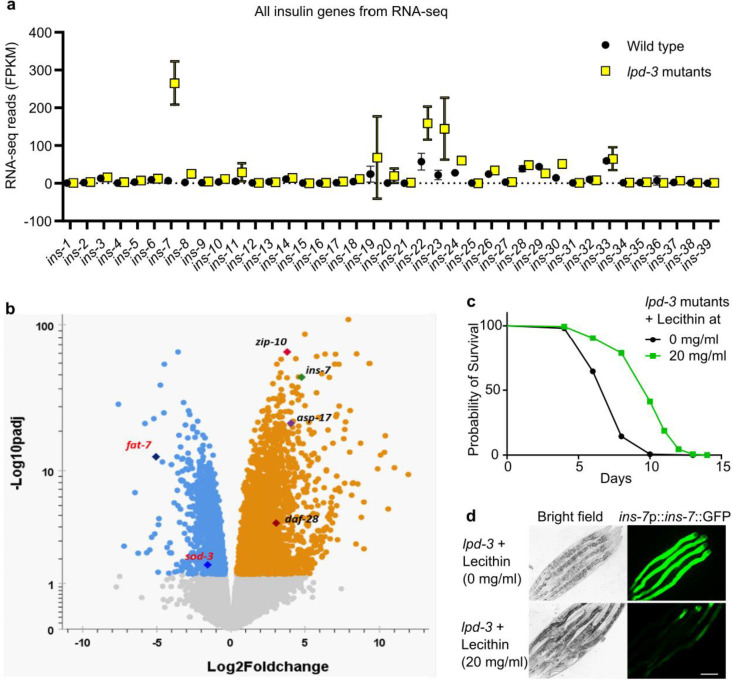
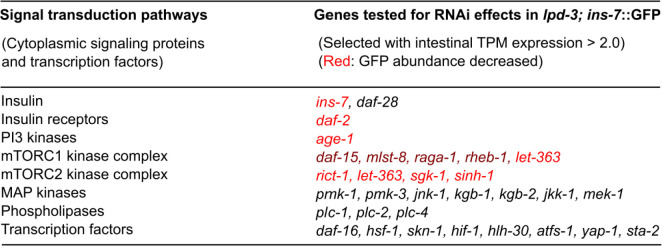
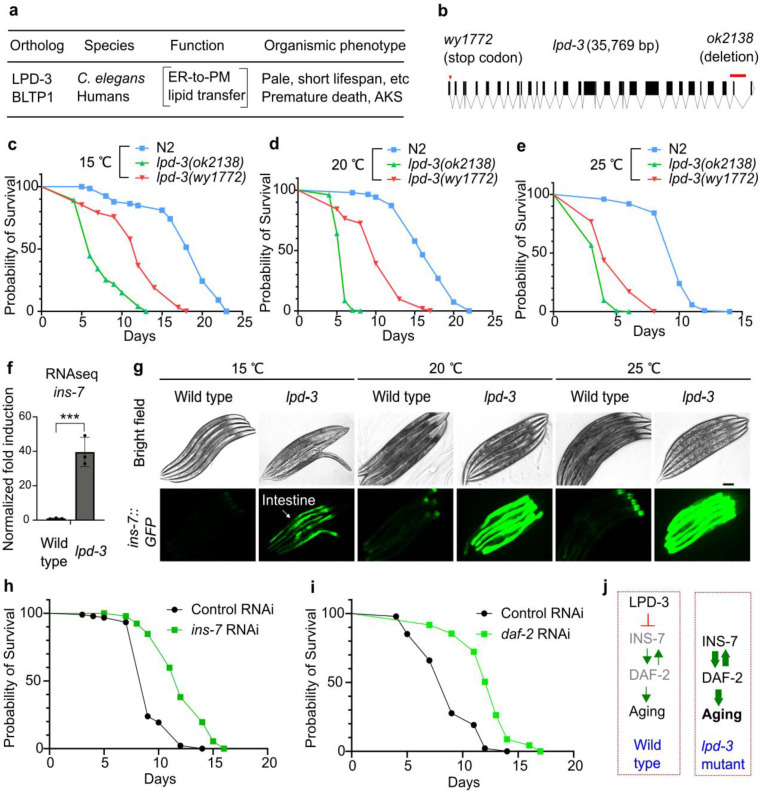
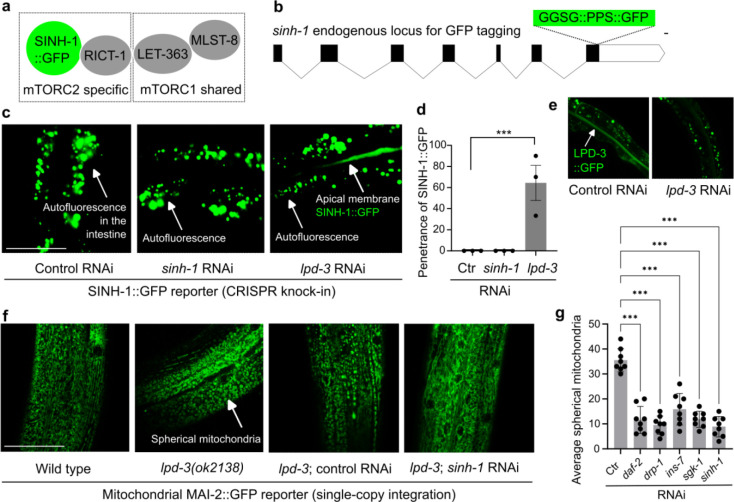
Insulin-mTOR signaling drives anabolic growth during organismal development, while its late-life dysregulation may detrimentally contribute to aging and limit lifespans. Age-related regulatory mechanisms and functional consequences of insulin-mTOR remain incompletely understood. Here we identify LPD-3 as a megaprotein that orchestrates the tempo of insulin-mTOR signaling during C. elegans aging. We find that an agonist insulin INS-7 is drastically over-produced in early life and shortens lifespan in lpd-3 mutants, a C. elegans model of human Alkuraya-Kučinskas syndrome. LPD-3 forms a bridge-like tunnel megaprotein to facilitate phospholipid trafficking to plasma membranes. Lipidomic profiling reveals increased abundance of hexaceramide species in lpd-3 mutants, accompanied by up-regulation of hexaceramide biosynthetic enzymes, including HYL-1 (Homolog of Yeast Longevity). Reducing HYL-1 activity decreases INS-7 levels and rescues the lifespan of lpd-3 mutants through insulin receptor/DAF-2 and mTOR/LET-363. LPD3 antagonizes SINH-1, a key mTORC2 component, and decreases expression with age in wild type animals. We propose that LPD-3 acts as a megaprotein brake for aging and its age-dependent decline restricts lifespan through the sphingolipid-hexaceramide and insulin-mTOR pathways.


Conflict of interest statement

Competing interests The authors declare no competing interests.

Figures

Extended Data Fig. 1
Extended Data Fig. 1. Lipofuscin increase and behavioral decline of lpd-3 mutants early in aging.
a, Quantification of locomotion speed for wild type and lpd-3 mutants showing a rapid decline in lpd-3 mutants starting at day 1 (24 hrs post-L4 stage). *** indicates P < 0.001 (N = 30–50 animals per group). b, Lipofuscin/age pigment fluorescence intensities for wild type and lpd-3 mutants showing a more rapid decline in lpd-3 mutants at day 2 (48 hrs post-L4 stage). c, Representative lipofuscin/age pigment fluorescence images for wild type and lpd-3 mutants showing a more rapid decline in lpd-3 mutants at day 2 (48 hrs post-L4 stage). Scale bar, 100 μm.
Extended Data Fig. 2
Extended Data Fig. 2. Specific up-regulation of ins-7 by loss of LPD-3 and rescue by Lecithin.
a, RNA-seq reveals drastic and specific ins-7 up-regulation among all ins genes examined. Results were derived and analyzed from RNA-seq datasets we published earlier. FPKM, Fragments Per Kilobase of transcript per Million mapped reads. b, Volcano plot showing significantly LPD-3 regulated genes, including fat-7 (downstream of SBP-1 and NHR-49), sod-3 (downstream of DAF-16) and zip-10 (downstream of ISY-1), asp-17 (downstream of ISY-1), and ins-7. c, Lifespan analysis of lpd-3 mutants with control or Lecithin treatment at 20 °C (P < 0.0001, log-rank test). d, Representative bright-field and epifluorescence images showing that ins-7p::ins-7::GFP up-regulation in lpd-3 mutants can be suppressed by exogenous Lecithin (20 mg/ml) treatment supplemented in culture media. Scale bar, 100 μm.
Extended Data Fig. 3
Extended Data Fig. 3. RNAi screens for genes affecting ins-7 in lpd-3 mutants.
Genes were selected for RNAi testing given their adequate expression values in intestine (TPM or transcript per million > 2.0) and putative roles in mediating insulin-mTOR signaling.
Extended Data Fig. 4
Extended Data Fig. 4. Model of how LPD-3 acts as a brake for aging through sphingolipid and insulin-mTOR regulatory pathways.
In the wild type, LPD-3 mediates phospholipid trafficking from ER to PM, and in turn, suppresses sphingolipid levels. Insulin and mTOR signaling are activated at moderate levels to promote early-life growth and late-life aging. In the lpd-3 mutants, reduced LPD-3 function leads to sphingolipid (hexaceramide type) up-regulation and hyperactivation of insulin and mTOR signaling. INS-7/DAF-2/mTORC2 forms a proposed vicious cycle to sustain insulin and mTOR activation through a positive feedback loop, culminating in hastened late-life aging and shortened lifespan. Red indicates inhibition, while green indicates activation. Solid arrows indicate proposed action based on this study, while dashed arrows indicate regulation inferred from the literature.
Fig. 1
Fig. 1. Hyper-activation of ins-7 causes shortened lifespan in lpd-3 mutants.
a, Cellular function and organismic phenotypes for LPD-3 and the human homologue BLTP1. b, Gene diagram showing two alleles of lpd-3 examined for lifespan phenotypes. c, Lifespan analysis of wild type versus lpd-3 mutants with two different alleles (ok2138 and wy1772) grown at 15 °C. d, Lifespan analysis of wild type versus lpd-3 mutants with two different alleles (ok2138 and wy1772) grown at 20 °C. e, Lifespan analysis of wild type versus lpd-3 mutants with two different alleles (ok2138 and wy1772) grown at 25 °C. f, RNA-seq results showing increased ins-7 expression in lpd-3 mutants. Values are means ± S.D. *** indicates P < 0.001 (N = 3 biological replicates). g, Representative bright-field and epifluorescence images showing drastically increased ins-7p::ins-7::GFP abundance in lpd-3 mutants. Scale bar, 100 μm. h, Lifespan analysis of lpd-3 mutants with control or ins-7 RNAi at 20 °C, showing shortened lifespan rescued (P < 0.0001, log-rank test). i, Lifespan analysis of lpd-3 mutants with control or daf-2 RNAi at 20 °C, showing shortened lifespan rescued (P < 0.0001, log-rank test). j, Schematic diagrams illustrating a model of how LPD-3 regulates aging via INS-7 and DAF-2 in wild type and lpd-3 mutants.
Fig. 2
Fig. 2. LPD-3 regulates INS-7 via the sphingolipid-ceramide-mTORC2 axis.
a, Table summarizing effects of RNAi against genes in the insulin/mTORC1/mTORC2 pathway on ins-7p::ins-7::GFP levels in lpd-3 mutants. * indicates GFP intensity observed under microscope. b, Representative bright-field and epifluorescence images showing ins-7p::ins-7::GFP up-regulation in lpd-3 mutants can be suppressed by RNAi against daf-2, rict-1 or hyl-1. Scale bar, 100 μm. c, Lipidomic quantification of hexaceramide species in wild type and lpd-3 mutants. Values are means ± S.D. (N = 3 biological replicates). d, Schematic showing biosynthetic pathways of hexaceramide, including sphingosine conversion to ceramide by HYL-1 and ceramide to hexaceramide by CGT-1/2/3. e, RNA-seq results showing increased hyl-1 and cgt-1/2/3 expression in lpd-3 mutants. Values are means ± S.D. ***P < 0.001 (N = 3 biological replicates). f, Lifespan analysis of lpd-3 mutants with control or rict-1 RNAi at 20 °C, showing rescued lifespan (P < 0.0001, log-rank test). g, Lifespan analysis of lpd-3 mutants with control or hyl-1 RNAi at 20 °C, showing rescued lifespan (P< 0.0001, log-rank test). h, Lifespan analysis of lpd-3 mutants with control or sgk-1 RNAi at 20 °C, showing rescued lifespan (P < 0.0001, log-rank test).
Fig. 3
Fig. 3. Loss of LPD-3 dysregulates SINH-1/mTORC2 and mitochondria.
a, Schematic showing key components of the mTORC2 complex in the SINH-1::GFP tagged C. elegans. b, Schematic gene structure of sinh-1 showing the CRISPR-mediated knock-in allele encoding the endogenous SINH-1 tagged with a linker (GGGS), PreScission Protease site (PPS) and GFP. Scale bar: 100 bp. c, Representative confocal fluorescence images showing undetectable SINH-1::GFP signals in animals treated with control or sinh-1 RNAi but increased SINH-1::GFP enrichment along the apical intestinal membrane in animals treated with lpd-3 RNAi (non-specific gut autofluorescence not affected by sinh-1 or lpd-3 RNAi also indicated). d, Quantification of the penetrance of SINH-1::GFP enrichment at the apical intestinal membrane in animals with indicated RNAi treatment. Values are means ± S.E.M. ***P < 0.001 (N = 3 independent experiments, n > 10 in each trial). e, Representative confocal fluorescence images showing decreased LPD-3::GFP by lpd-3 RNAi. f, Representative confocal fluorescence images showing increased spherical MAI-2::GFP marked mitochondria in lpd-3 mutants (day 1) that can be normalized by sinh-1 but not control RNAi. g, Quantification showing rescued mitochondrial morphological defects in lpd-3 mutants by RNAi against genes encoding the mitochondrial fission machinery (drp-1) or insulin-mTOR pathway components (e.g. sinh-1). Values are means ± S.E.M. ***P < 0.001 (N = 8 biological replicates).
Fig. 4
Fig. 4. LPD-3 abundance and functions decline with age in wild type animals.
a, Schematic gene structure of lpd-3 showing the CRISPR-mediated knock-in allele encoding the endogenous LPD-3 tagged with a split GFP1–10 that is complemented by an intestine-expressed GFP11. Scale bar: 500 bp. b, Representative confocal fluorescence images showing age-dependent decrease in the abundance of LPD-3::GFP signals in the intestinal apical membrane of animals at the stages of L4, day 1, 3, 5 and 9 post-L4. c, Quantification of the fluorescence intensities of LPD-3::GFP in animals with indicated ages. Values are means ± S.E.M. ***P < 0.001 (N = 6 biological replicates). d, Representative confocal fluorescence images showing age-dependent decrease in the abundance of Akt-PH::GFP signals that label PIP2/3 in the intestinal apical membrane of animals at the stages of L4, day 1, 3, 5 and 9 post-L4, in both wild type and lpd-3 mutants. Scale bar: 50 μm. e, Quantification of the fluorescence intensities of Akt-PH::GFP at apical intestinal membranes in animals with indicated ages. Values are means ± S.E.M. ***P < 0.001 (N = 8 biological replicates in each stage, N = 32 in each genotype). f, Representative confocal fluorescence images showing age-dependent increase in the abundance of ins-7p::INS-7::GFP signals in animals at the indicated stages in both wild type and lpd-3 mutants. Scale bar: 50 μm. e, Quantification of the fluorescence intensities of ins-7p::INS-7::GFP in animals with indicated ages. Values are means ± S.E.M., with ** P < 0.01 and ***P < 0.001 (N = 7 biological replicates).

References

    1. Blagosklonny M. V. Aging and immortality: quasi-programmed senescence and its pharmacologic inhibition. Cell Cycle 5, 2087–2102 (2006). - PubMed
    1. Blagosklonny M. V. The hyperfunction theory of aging: three common misconceptions. Oncoscience 8, 103–107 (2021). - PMC - PubMed
    1. Gems D. The hyperfunction theory: An emerging paradigm for the biology of aging. Ageing Res Rev 74, 101557 (2022). - PMC - PubMed
    1. Gladyshev V. N. Aging: progressive decline in fitness due to the rising deleteriome adjusted by genetic, environmental, and stochastic processes. Aging Cell 15, 594–602 (2016). - PMC - PubMed
    1. Longo V. D., Mitteldorf J. & Skulachev V. P. Programmed and altruistic ageing. Nat Rev Genet 6, 866–872 (2005). - PubMed

Publication types