[Preprint]. 2023 Aug 25:2023.02.13.528384.
doi: 10.1101/2023.02.13.528384.

Mitochondrial Pyruvate Carrier Inhibition Attenuates Hepatic Stellate Cell Activation and Liver Injury in a Mouse Model of Metabolic Dysfunction-associated Steatotic Liver Disease

Affiliations

Mitochondrial Pyruvate Carrier Inhibition Attenuates Hepatic Stellate Cell Activation and Liver Injury in a Mouse Model of Metabolic Dysfunction-associated Steatotic Liver Disease

Mohammad Habibi et al. bioRxiv. .

Abstract

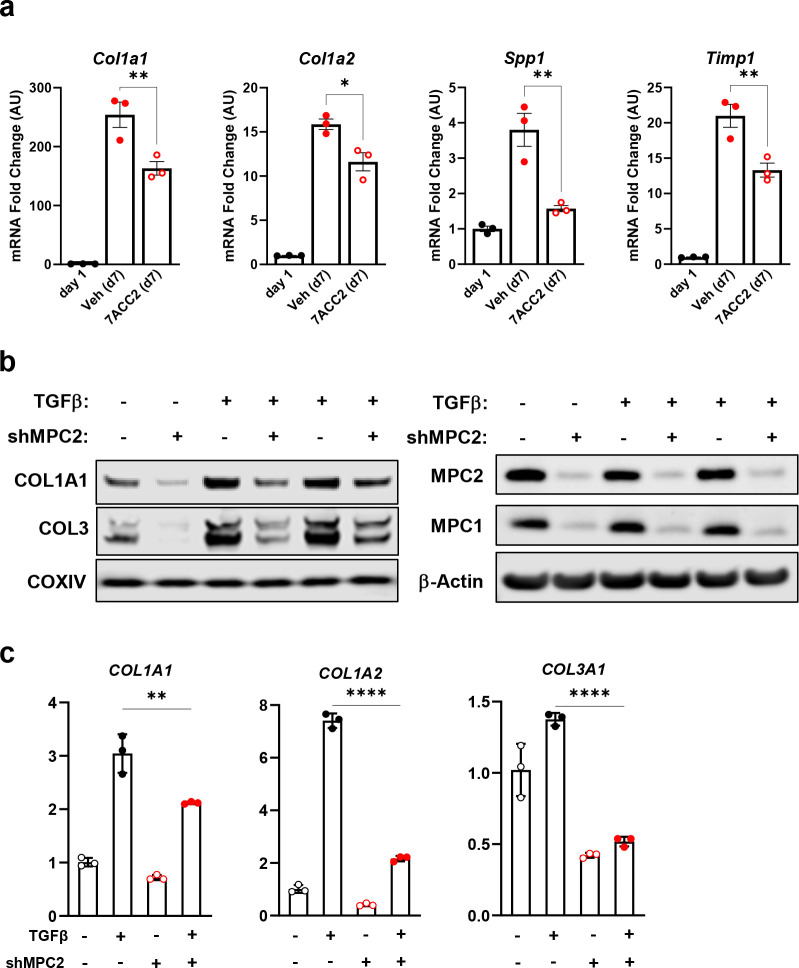
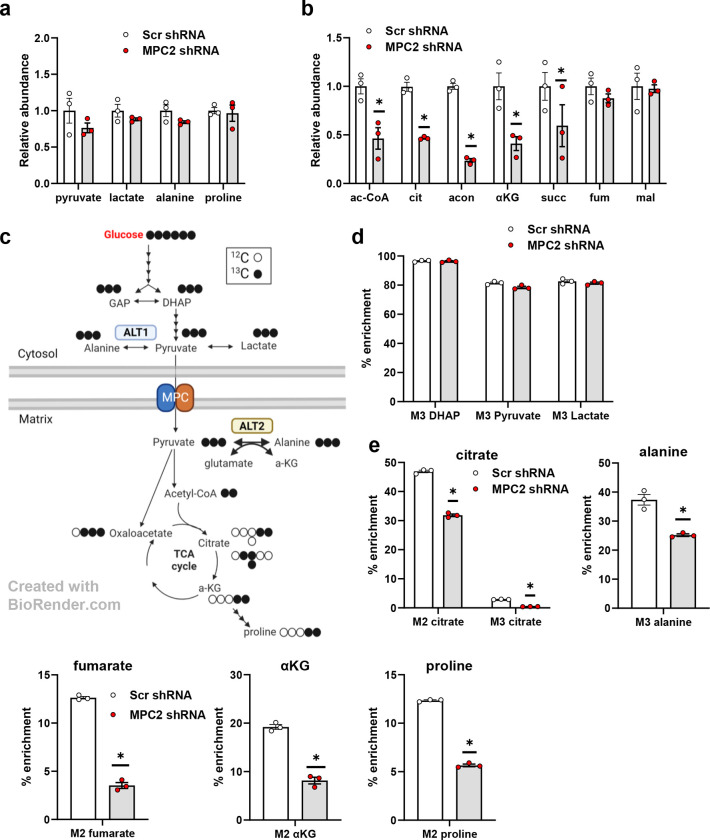
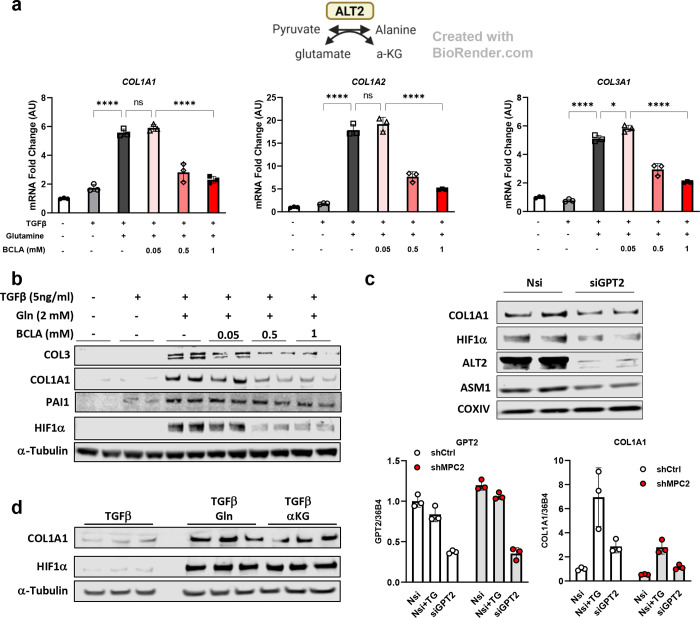
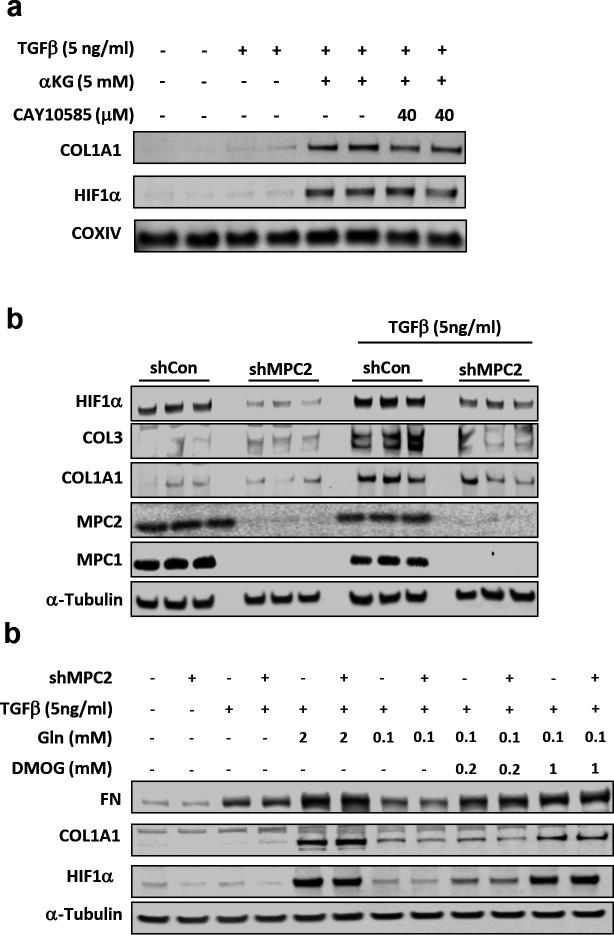
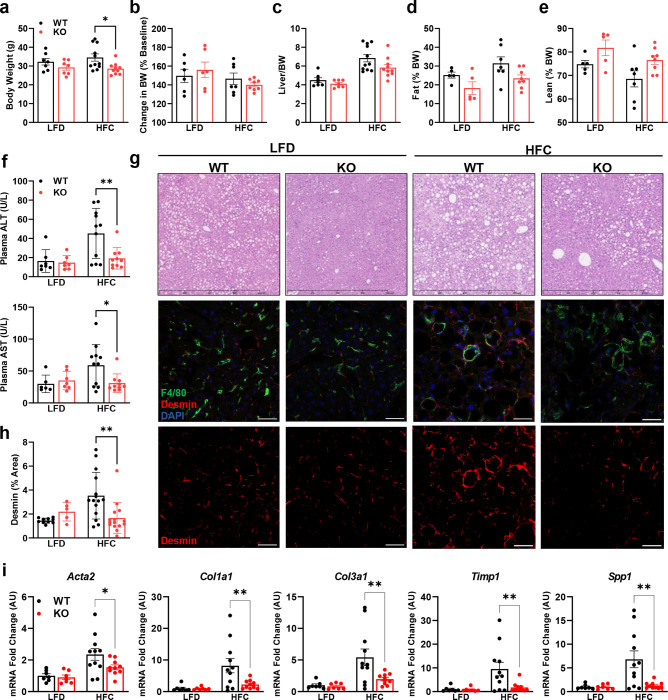
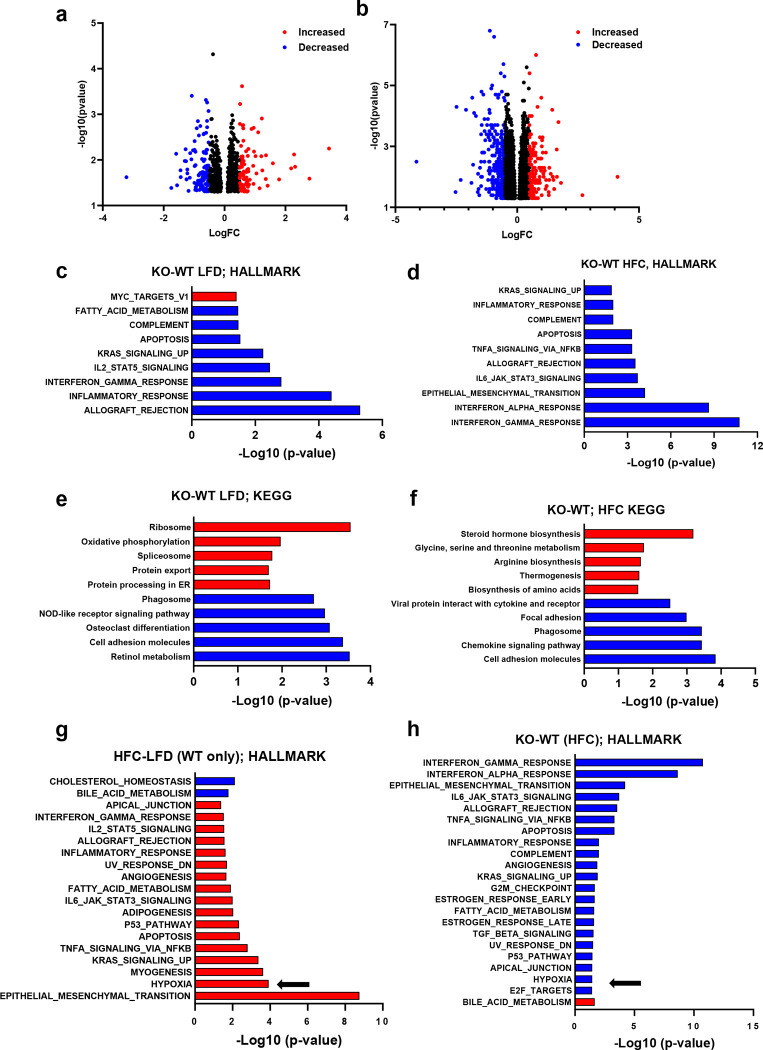
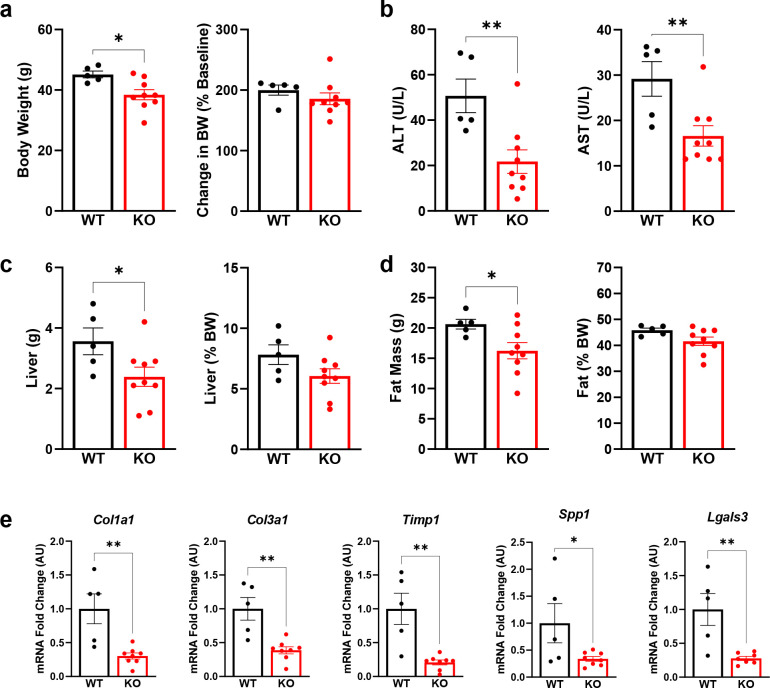
Hepatic stellate cells (HSC) are non-parenchymal liver cells that produce extracellular matrix comprising fibrotic lesions in chronic liver diseases. Prior work demonstrated that mitochondrial pyruvate carrier (MPC) inhibitors suppress HSC activation and fibrosis in a mouse model of metabolic dysfunction-associated steatohepatitis (MASH). In the present study, pharmacologic or genetic inhibition of the MPC in HSC decreased expression of markers of activation in vitro. MPC knockdown also reduced the abundance of several intermediates of the TCA cycle, and diminished α-ketoglutarate played a key role in attenuating HSC activation by suppressing hypoxia inducible factor-1α signaling. On high fat diets, mice with HSC-specific MPC deletion exhibited reduced circulating transaminases, numbers of HSC, and hepatic expression of markers of HSC activation and inflammation compared to wild-type mice. These data suggest that MPC inhibition modulates HSC metabolism to attenuate activation and illuminate mechanisms by which MPC inhibitors could prove therapeutically beneficial for treating MASH.


Figures

Fig. 1:
Fig. 1:. Genetic or pharmacological inhibition of the MPC reduces hepatic stellate cell activation in vitro.
a, Hepatic stellate cells (HSC) were isolated from wild-type Mpc2fl/fl mice and cultured for up to 7 days (d7) and treated with the addition of vehicle (DMSO; Veh) or 7ACC2 (1 μM). A portion were harvested after 1 day of culture (non-treated, d1) for quiescent HSC. Gene expression was measured by qRT-PCR and data are expressed as mean ± SEM, relative to d1 HSC. *p<0.05, **p<0.01. b, Human hepatic stellate cells (LX2) expressing shRNA against MPC2, reduced collagen protein abundance. TGFβ-1 (5 ng/mL) was added into culture medium to activate LX2 cells. c, Collagen isoforms gene expression were decreased in activated LX2 cells expressing shRNA against MPC2. Data are expressed as mean ± SEM, relative to control cells expressing non-targeting shRNA. *p < 0.05, **p < 0.01, ***p < 0.001, ****p < 0.0001.
Fig. 2:
Fig. 2:. The MPC suppression markedly reduced several TCA cycle intermediates in LX2 cells treated with uniformly labeled 13C-glucose.
a, The effect of MPC shRNA on relative abundance of glycolytic end products in LX2 cells treated with uniformly labeled 13C-glucose isotope. b, MPC suppression in LX2 cells reduced the relative abundance of several TCA cycle metabolites. c, Schematic of TCA cycle alterations measured by metabolomic analyses of LX2 cells stably expressing shRNA against MPC2. Red arrows, decreased; blue arrows, unchanged (comparing MPC2 shRNA to scrambled shRNA) d, Incorporation of 13C-glucose into glycolytic and TCA cycle intermediates in LX2 cells. TGFβ-1 (5 ng/mL) added into media to activate LX2 cells. GAP, glyceraldehyde 3-phosphate; DHAP, dihydroxyacetone phosphate; αKG, alpha-ketoglutarate; ALT2, alanine transaminase 2. Data are expressed as mean ± SEM, relative to TGFβ-1-free cells expressing non-targeting shRNA (n= 3 or 6). *p < 0.05.
Fig. 3:
Fig. 3:. Alanine transaminase inhibition reduced HSC activation.
a, Schematic for the reaction catalyzed by ALT2. COL1A1, COL1A2, and COL3A1 gene expression in LX2 cells treated with/without TGFβ (5 ng/mL), glutamine (2 mM), and β-chloroalanine (BCLA; 0.05, 0.5, 1 mM). b, Western blot images for COL3, COL1A1, PAI1, HIF1α, and α-Tubulin in LX2 cells treated with BCLA. c, Protein abundance and gene expression of activation markers in either GPT2 knockdown LX2 or GPT2/MPC2 knockdown LX2 cells. For protein abundance, all groups were treated with 5 ng/mL TGFβ-1. d, Western blot images for COL1A1, HIF1α, and α-Tubulin in LX2 cells treated with or without glutamine (Gln, 2 mM) or dm-αKG (5 mM) compared with TGFβ-1 (5 ng/mL) treated cells.
Fig. 4:
Fig. 4:. MPC suppression attenuated HSC activation through diminished activation of hypoxia inducible factor 1α.
a, Western blot images for COL1A1, HIF1α, and COXIV in LX2 cells treated with dm-αKG (5 mM) and CAY10585. b, Western blot images for HIF1α, COL3, COL1A1, MPC2, MPC1, and α-Tubulin in LX2 cells expressing shRNA against MPC2. Cells treated with or without TGFβ-1 (5 ng/mL). c, Western blot images for FN, COL1A1, HIF1α, and α-Tubulin in LX2 cells expressing MPC2 shRNA. Cells treated with TGFβ-1 (5 ng/mL), two doses of Gln (2 and 0.1 mM), and two doses of dimethyloxallyl glycine (DMOG; 0.2 and 1 mM;), a cell-permeable HIF1α stabilizer.
Fig. 5:
Fig. 5:. Lrat-Mpc2−/− mice are protected from MASH-inducing diet.
At about 8 weeks of age, littermate wild-type (WT) and Lrat-Mpc2−/− (KO) mice were placed on either a low-fat diet (LFD) or a diet high in fat, fructose, and cholesterol (HFC) for a period of 12 weeks. a,b, Terminal body weight, expressed as total mass (a) and percent body weight gain from initiation of diet (b). c, Liver weight measured at sacrifice, expressed as percent body weight. c,d, Body composition determined by EchoMRI for both (c) fat mass and (d) lean mass, represented as percent body weight. f, Plasma levels of circulating transaminases ALT and AST collected at sacrifice. g, Representative liver sections with H&E staining and immunofluorescence staining for hepatic stellate cells (Desmin), macrophages (F4/80), and nuclei (DAPI). h, Quantification of desmin staining. i, Hepatic gene expression measured by RT-qPCR and expressed relative to WT LFD control group. All data expressed as mean ± SEM (n=7–11/group). *p<0.05, **p<0.01.
Fig. 6:
Fig. 6:. RNAseq reveals reduced immune responses and HIF1a signaling in Lrat-Mpc2−/− mice.
RNA sequencing was performed on liver tissue from both wild-type (WT) and Lrat-Mpc2−/− (KO) mice and placed on either a LFD or HFC diet (n=5/group). a,b, Volcano plots of differentially expressed genes with p-value <0.05 comparing (a) KO versus WT mice on LFD and (b) KO versus WT mice on HFC diet. Differentially expressed genes with Log fold change (LogFC) less than −0.5, or greater than 0.5, were highlighted in either blue or red, respectively. Analysis of perturbations in Hallmark gene set collections when comparing (c) KO versus WT mice on LFD and (d) KO versus WT mice on HFC diet. Changes in KEGG signaling and metabolism pathways when comparing (e) KO versus WT mice on LFD and (f) KO versus WT mice on HFC diet. Analysis of perturbations in Hallmark gene set collections when comparing, g, HFC diet versus LFD in WT mice and, h, KO versus WT mice on HFC diet. The arrows highlight hypoxia signaling pathways.
Fig. 7:
Fig. 7:. Lrat-Mpc2−/− mice are protected from MASH exacerbated by thermoneutral housing.
At about 8 weeks of age, littermate wild-type (WT) and Lrat-Mpc2−/− (KO) mice were placed in thermoneutral housing (30°C) for 20 weeks. a, Terminal body weight, expressed as total mass and percent body weight gain from initiation of diet. b, Plasma levels of circulating transaminases ALT and AST collected at sacrifice. c, Liver weight measured at sacrifice, expressed as total mass and percent body weight. d, Analysis of fat mass determined by EchoMRI, represented as total mass and percent body weight. e, Hepatic gene expression measured by RT-qPCR and expressed relative to WT group. All data expressed as mean ± SEM (n=5–9/group). *p<0.05, **p<0.01.

References

    1. Younossi Z.M., et al. , Global epidemiology of nonalcoholic fatty liver disease-Meta-analytic assessment of prevalence, incidence, and outcomes. Hepatology, 2016. 64(1): p. 73–84. - PubMed
    1. Younossi Z., Global burden of NAFLD and NASH: trends, predictions, risk factors and prevention. Nat. Rev. Gastroenterol. Hepatol., 2018. 15. - PubMed
    1. Taylor R.S., et al. , Association Between Fibrosis Stage and Outcomes of Patients With Nonalcoholic Fatty Liver Disease: A Systematic Review and Meta-Analysis. Gastroenterology, 2020. - PubMed
    1. Wang S., et al. , An autocrine signaling circuit in hepatic stellate cells underlies advanced fibrosis in nonalcoholic steatohepatitis. Science Translational Medicine, 2023. 15(677): p. eadd3949. - PMC - PubMed
    1. Liu W., et al. , Pathogenesis of nonalcoholic steatohepatitis. Cellular and Molecular Life Sciences, 2016. 73: p. 1969–1987. - PMC - PubMed

Publication types