[Preprint]. 2023 Feb 15:2023.02.15.528539.
doi: 10.1101/2023.02.15.528539.

Tumor Niche Network-Defined Subtypes Predict Immunotherapy Response of Esophageal Squamous Cell Cancer

Affiliations

Tumor Niche Network-Defined Subtypes Predict Immunotherapy Response of Esophageal Squamous Cell Cancer

Kyung-Pil Ko et al. bioRxiv. .

Update in

Abstract

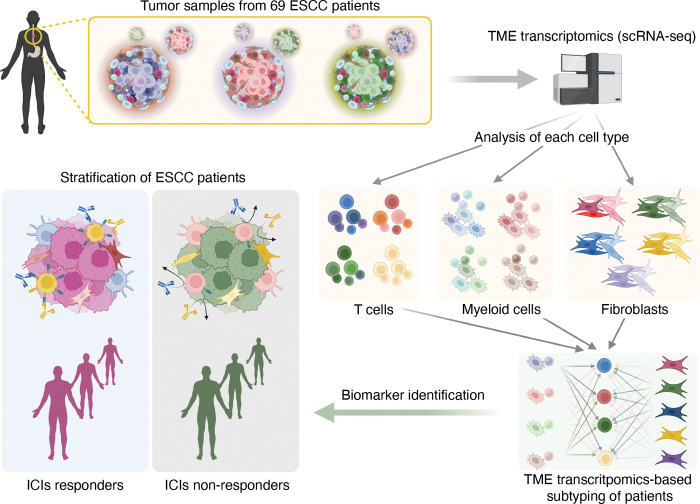
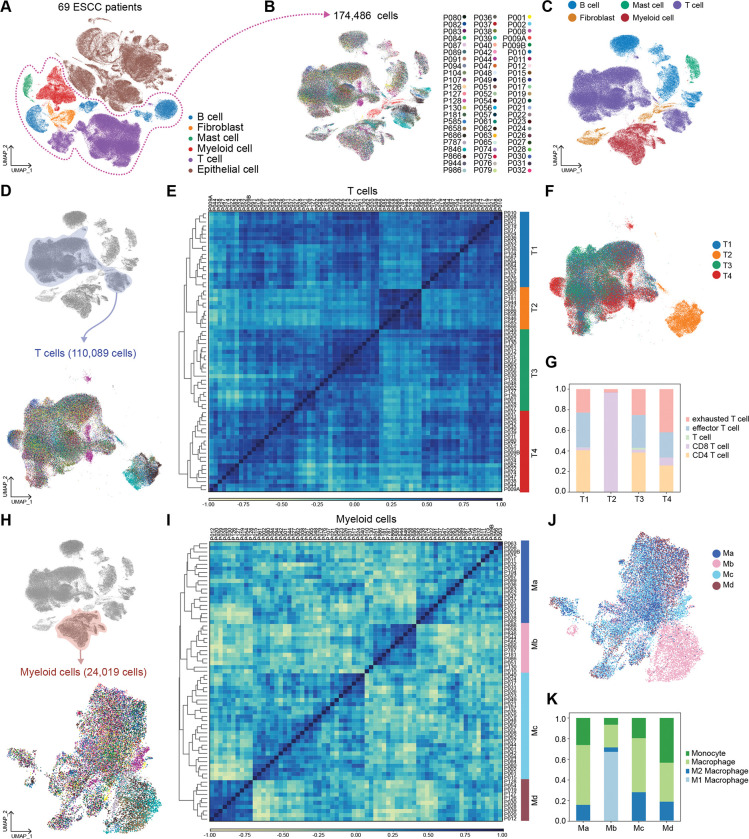
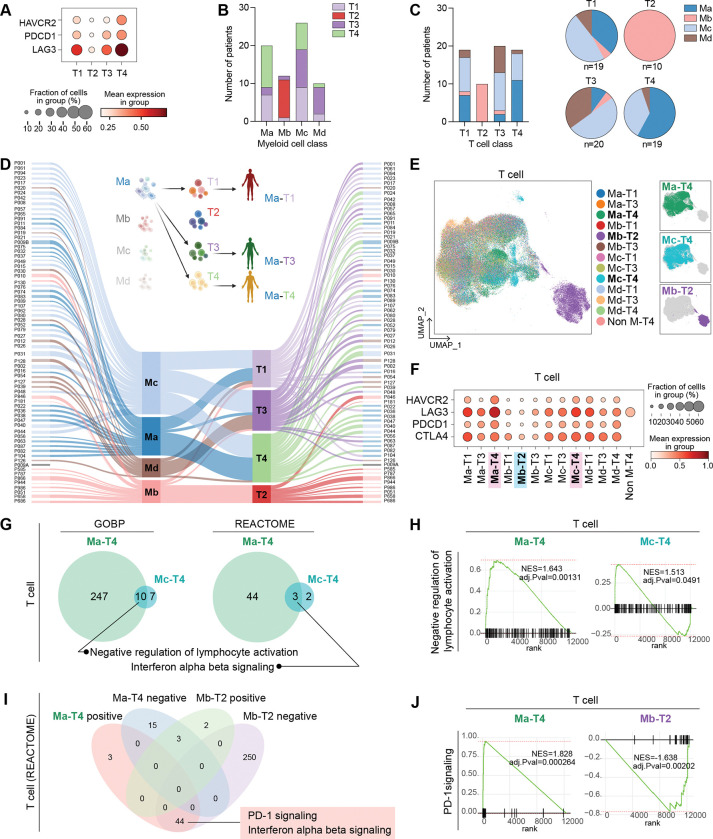
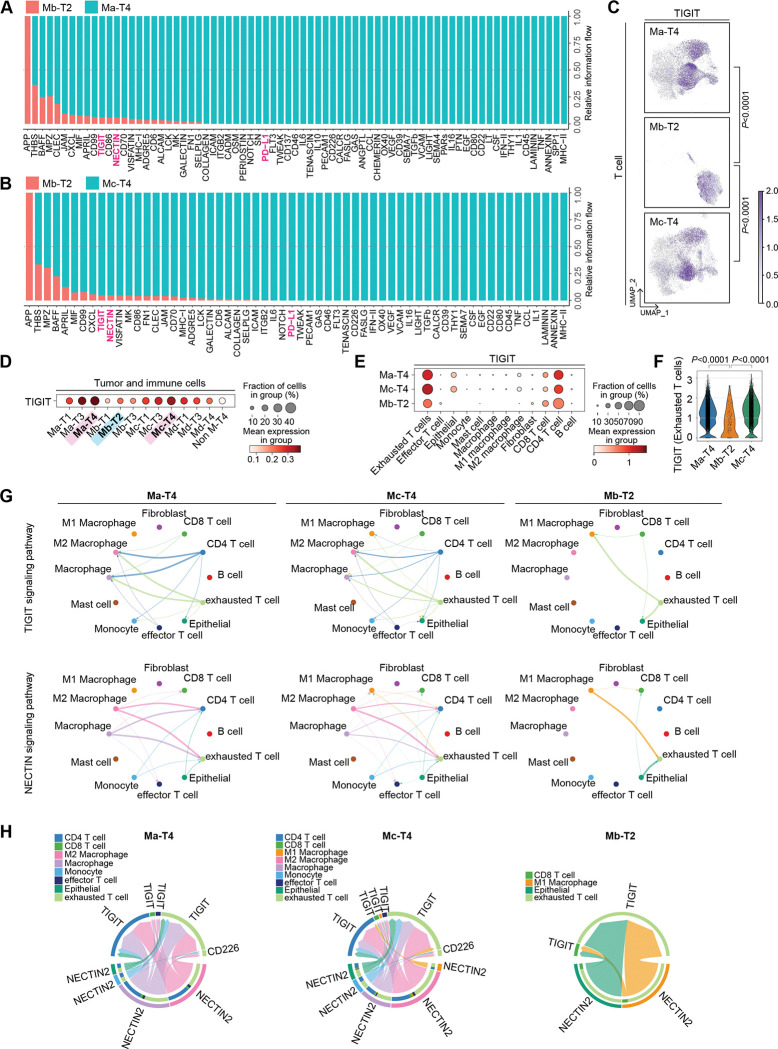
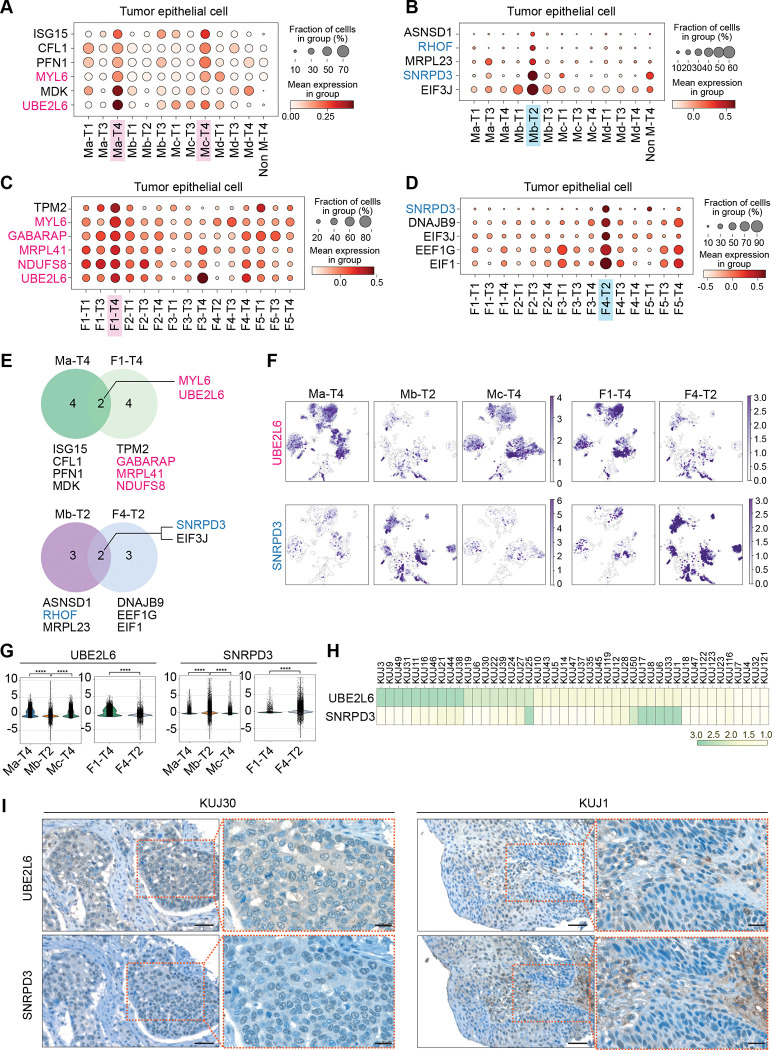
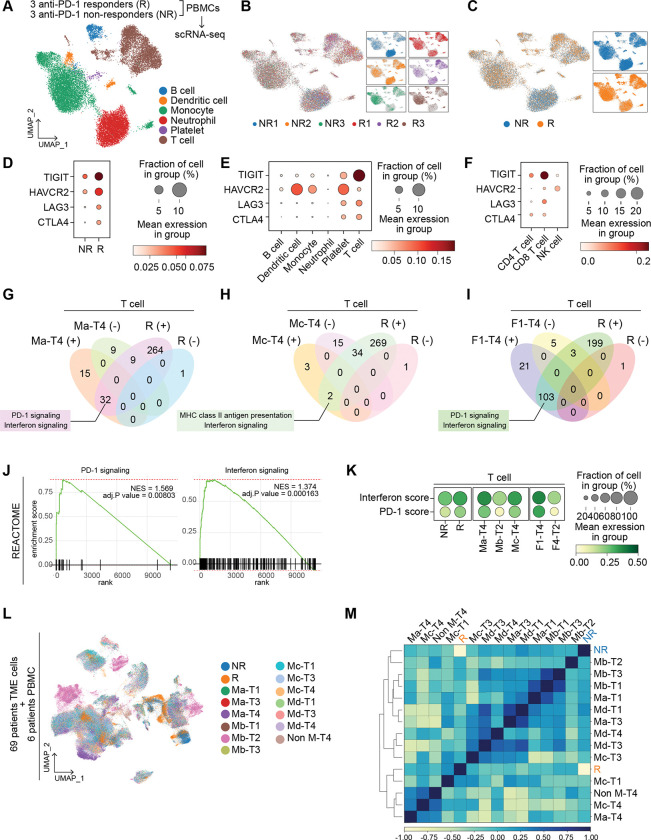
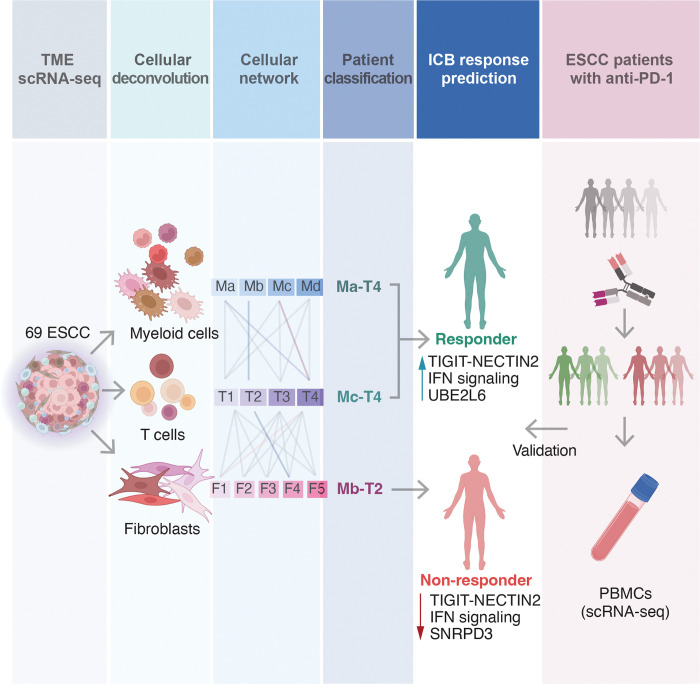
Despite the promising outcomes of immune checkpoint blockade (ICB), resistance to ICB presents a new challenge. Therefore, selecting patients for specific ICB applications is crucial for maximizing therapeutic efficacy. Herein we curated 69 human esophageal squamous cell cancer (ESCC) patients' tumor microenvironment (TME) single-cell transcriptomic datasets to subtype ESCC. Integrative analyses of the cellular network transcriptional signatures of T cells, myeloid cells, and fibroblasts define distinct ESCC subtypes characterized by T cell exhaustion, Interferon (IFN) a/b signaling, TIGIT enrichment, and specific marker genes. Furthermore, this approach classifies ESCC patients into ICB responders and non-responders, as validated by liquid biopsy single-cell transcriptomics. Our study stratifies ESCC patients based on TME transcriptional network, providing novel insights into tumor niche remodeling and predicting ICB responses in ESCC patients.

Keywords: Esophageal squamous cell cancer; cancer immunotherapy; immune checkpoint inhibitors; immunotherapy resistance; single-cell transcriptomics; tumor microenvironment (TME).


Conflict of interest statement

Disclosure of Potential Conflicts of Interest No potential conflicts of interest were disclosed.

Figures

Figure 1 |
Figure 1 |. Schematic workflow for transcriptomic analysis of TME from ESCC patients.
Figure 2 |
Figure 2 |. Immune cells analysis and classification.
A, Uniform Manifold Approximation and Projection (UMAP) display of whole cells from 69 patients. Single-cell RNA-sequencing (scRNA-seq) results of the cells of TME were integrated and projected B-C, Non-epithelial cells were isolated, and UMAP was redrawn with individual patient’s information. (B) and five major cell types (C). D, UMAP display of T cells subgroup with unique patients ID. T cells were isolated from immune cells and clustered again. E, T cells were classified into four sub-groups by principal component analysis (PCA) and Pearson correlation. PCA result was clustered by the dendrogram, and Pearson correlation was displayed by color spectrum. F, T cells were displayed in UMAP based on the sub-groups defined from PCA and Pearson correlation. G, Each sub-groups of T cells were shown with subsets using stacked bar plots. H, Myeloid cells of each patient were displayed with UMAP. Myeloid cells were isolated from immune cells and clustered independently. I, Myeloid cells were categorized into four sub-groups by PCA and Pearson correlation. PCA results were displayed with a dendrogram, and Pearson correlation was shown by color spectrum. J, Myeloid cells were displayed with sub-groups identified from PCA and Pearson correlation. K, Each myeloid cell sub-group was displayed with subsets of myeloid cells.
Figure 3 |
Figure 3 |. Comparative analysis of patients by myeloid and T cell classifications.
A, Tex cell markers expression in each T cell sub-group. B, The number of patients of T cell-sub-groups was displayed in each patient’s sub-groups categorized by myeloid cells. C, The number of myeloid cell-sub-groups was displayed in each patient’s sub-groups categorized by T cells. The proportion of myeloid-cell-based classified patients in each sub-group of T cells was shown with pie plots. D, Individual patients were subjected to each sub-group of myeloid and T cells by Sankey plot. P009A patient was not included in the myeloid cell-based sub-group due to the lack of myeloid cells in the dataset. Each patient was classified into 13 groups (M-T groups) by sub-groups of myeloid cells and T cells and categories. E, Tex cell markers expression in T cells in M-T groups of patients. F, T cells of each patient from 13 groups were displayed with UMAP. G-H, GESA analysis was performed in T cells of M-T groups of patients. The results of GSEA from the Ma-T4 and Mc-T4 groups of patients were compared. GOBP and REACTOME databases were used, and the significant signaling pathways with positive values of NES were compared. Overlapped signaling pathways were displayed with a Venn diagram (G) and enrichment plot H). I-J, GSEA analysis was performed in T cells of Ma-T4 and Mb-T2 patients. significant signaling pathways with both positive and negative valued of NES were compared, and the shared signaling, which has positive values of NES in Ma-T4 and negative values of Mb-T2 were analyzed. The number of shared and exclusive signaling in each group was shown in the Venn diagram (I). PD-1 signaling, shared signaling in T cell GSEA analysis of Ma-T4 positive and Mb-T2 negative, was displayed with enrichment plots (J).
Figure 4 |
Figure 4 |. Cell-to-cell interactions comparison in M-T groups of patients.
A, Enriched cell-to-cell signaling calculated by CellChat was compared in the Ma-T4 and Mb-T2 group of patients. T cell exhaustion-related signaling pathways were highlighted. B, Enriched cell-to-cell signaling calculated by CellChat was compared in the Mc-T4 and Mb-T2 group of patients. T cell exhaustion-related signaling pathways were highlighted. C, TIGIT expression in the T cells was displayed with feature plots. T cells of Ma-T4, Mc-T4, and Mb-T2 groups were separated and projected. D, TIGIT expression in M-T groups was shown with a dot plot. All the cells, including tumor and immune cells, were compared in each group of patients. E, TIGIT expression in each cell type was compared. Ma-T4, Mc-T4, and Mb-T2 groups of patients were displayed. F, TIGIT expression in Tex cells was compared in Ma-T4, Mb-T2, and Mc-T4 sub-groups. G, Significant interactions within cell types were shown with circle plots. TIGIT and NECTIN signaling pathways were compared in the Ma-T4, Mc-T4, and Mb-T2 groups of patients. H, Specific genes related to NECTIN signaling pathways were displayed with chord plots. The source group of cell types was located on the bottom hemispheres, and the receiver group was on the top hemispheres. Ma-T4, Mc-T4, and Mb-T2 groups of patients were compared.
Figure 5 |
Figure 5 |. Fibroblasts classification and patients grouping with T cell class.
A, Fibroblasts of each patient were isolated and independently analyzed. UMAP labeled with each patient was shown. B, Fibroblasts were classified into five sub-groups by principal component analysis (PCA) and Pearson correlation. PCA result was clustered by the dendrogram, and Pearson correlation was displayed by color spectrum. C, Fibroblasts classification was displayed in UMAP. D, The number of patients of T cell sub-groups was displayed in each sub-group categorized by fibroblasts. E, The number of patients of fibroblast sub-groups was displayed in each sub-group categorized by T cells. The patient proportion of each fibroblast sub-group was shown on T cell sub-groups with pie plots. F, Sankey plot showing the connection of each patient’s fibroblast and T cell categories. Patients were re-grouped by fibroblast and T cell categories (F-T group), and T cells of the patients were shown with the F-T group. G, Tex markers expression was compared in F-T groups in T cells with dot plots. H, Spatial location of T cells of F1-T4 and F4-T2 groups were shown on the UMAP. I, Fibroblasts from F1-T4 and F4-T2 groups were subjected to GSEA analysis using the REACTOME database. Significant signaling pathways were listed with positive values of NES and negative values of NES. Shared or exclusive signaling pathways between F1-T4 and F4-T2 were visualized with a Venn diagram. J-K, Overlapped signaling pathways in F1-T4-positive and F4-T2-negative values of NES from GSEA. Enrichment plots of Signaling by interleukins (J) and TGF-β signaling in EMT (K) were displayed.
Figure 6 |
Figure 6 |. Biomarkers of tumor cells based on M-T or F-T groups and their correlation with prognosis.
A-D, Patients’ epithelial cells were grouped by M-T and F-T categories, and each group was projected to DEG analysis. The genes of which high expression are related to poor prognosis of ESCC patients were highlighted in red. The genes of which high expression related to better prognosis of ESCC patients were highlighted in blue. M1-T4- and M3-T4-specific (A) and M2-T2-specific (B) marker genes were displayed with dot plots. F1-T4-specific (C) and F4-T2-specific (D) marker genes were displayed with dot plots. E-G, Identified biomarkers from Ma-T4, F1-T4, Mb-T2, and F4-T2 were displayed with Venn diagram (E), and gene expression in each group was shown with UMAP (F). Expression of overlapped marker genes shown in the Venn diagram was compared in Ma-T4, Mb-T2, Mc-T4, F1-T4, and F4-T2 classified epithelial cells using violin plots (G). H-I, Immunohistochemistry of UBE2L6 and SNRPD3 from human ESCC were shown with scored heatmap (H) and representative images (I). IHC scores displayed from 1 (lowest expression) to 3 (highest expression). Scale bars = 50 μm (lower magnification) and 20 μm (higher magnification). ****p<0.0001.
Figure 7 |
Figure 7 |. Single-cell transcriptomics of immune cells of anti-PD-1 immunotherapy-treated patients.
A-C, Peripheral blood immune cells transcriptomes of three responders (R) and three non-responders (NR) (to anti-PD-1 ICI) were integrated and presented with UMAP by cell types (A), patients (B), and response groups (R vs. NR) (C). D-F, Tex marker genes expression were compared by the anti-PD-1 response (R vs. NR) (D), cell types (E), and T cell subsets (F). G-J, GSEA analysis performed by responders vs. non-responders using the REACTOME database. Significant results with positive NES and negative NES were listed with R positive and R negative, respectively. GSEA results were compared with Ma-T4 (G), Mc-T4 (H), and F1-T4 (I). Enrichment plots of PD-1 signaling and Interferon signaling were displayed (J). K, Pathway scores were compared in 3 groups( 1) responders and non-responders, 2) Ma-T4, Mb-T2, and Mc-T4, 3) F1-T4 and F4-T2) and shown with dotplots. L, single-cell transcriptomes of immunotherapy-experienced patients were integrated with 69 ESCC patients’ TME transcriptomes and shown with UMAP by M-T groups and anti-PD-1 response groups. M, Correlation matrix with M-T patient groups and anti-PD-1 response groups. PCA result was clustered by the dendrogram, and Pearson correlation was displayed by color spectrum.
Figure 8 |
Figure 8 |. Schematic representation of this study.
Single-cell transcriptomes of ESCC patients’ TME cells were analyzed to predict immunotherapy response and identify biomarkers and potential adjuvant therapies to improve efficacy. The prediction of responsiveness was retrospectively validated by examining transcriptomes of ICB-experienced patients’ immune cells.

References

    1. Sung H, Ferlay J, Siegel RL, Laversanne M, Soerjomataram I, Jemal A, et al. Global Cancer Statistics 2020: GLOBOCAN Estimates of Incidence and Mortality Worldwide for 36 Cancers in 185 Countries. CA Cancer J Clin. 2021;71(3):209–49. Epub 2021/02/05. doi: 10.3322/caac.21660. - DOI - PubMed
    1. Rustgi AK, El-Serag HB. Esophageal carcinoma. N Engl J Med. 2014;371(26):2499–509. Epub 2014/12/30. doi: 10.1056/NEJMra1314530. - DOI - PubMed
    1. Pennathur A, Gibson MK, Jobe BA, Luketich JD. Oesophageal carcinoma. Lancet. 2013;381(9864):400–12. Epub 2013/02/05. doi: 10.1016/S0140-6736(12)60643-6. - DOI - PubMed
    1. Baba Y, Yoshida N, Kinoshita K, Iwatsuki M, Yamashita YI, Chikamoto A, et al. Clinical and Prognostic Features of Patients With Esophageal Cancer and Multiple Primary Cancers: A Retrospective Single-institution Study. Ann Surg. 2018;267(3):478–83. Epub 2017/02/06. doi: 10.1097/SLA.0000000000002118. - DOI - PubMed
    1. Board PATE. Esophageal Cancer Treatment (Adult) (PDQ(R)): Patient Version. PDQ Cancer Information Summaries. Bethesda (MD)2002.

Publication types