[Preprint]. 2023 Feb 16:2023.02.16.528728.
doi: 10.1101/2023.02.16.528728.

Prediction and Design of Protease Enzyme Specificity Using a Structure-Aware Graph Convolutional Network

Affiliations

Prediction and Design of Protease Enzyme Specificity Using a Structure-Aware Graph Convolutional Network

Changpeng Lu et al. bioRxiv. .

Update in

Abstract

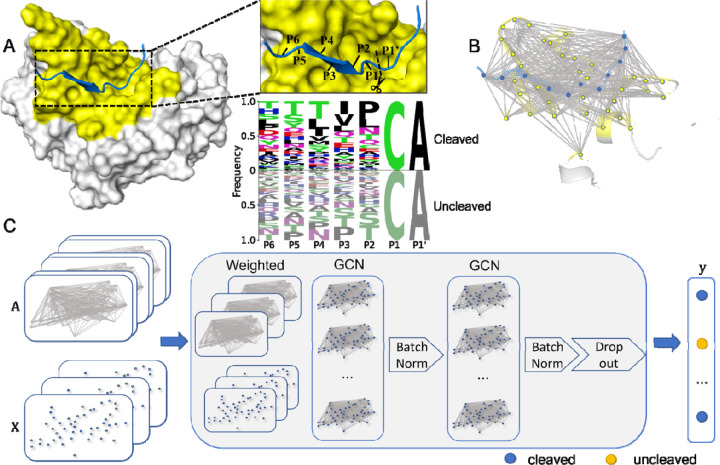
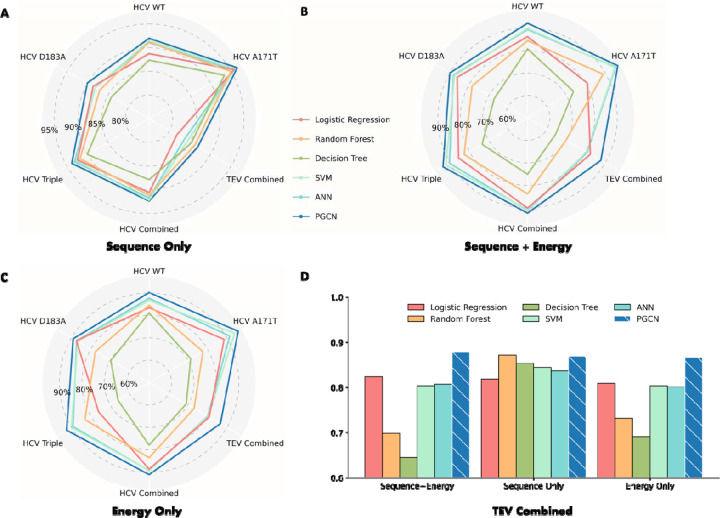
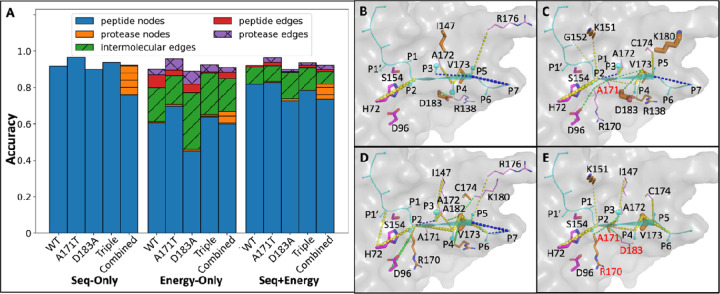
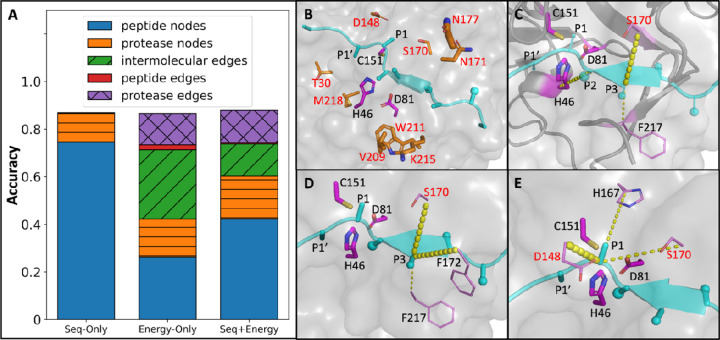
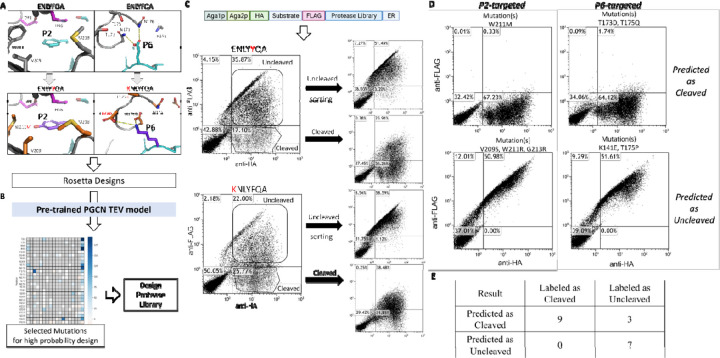
Site-specific proteolysis by the enzymatic cleavage of small linear sequence motifs is a key post-translational modification involved in physiology and disease. The ability to robustly and rapidly predict protease substrate specificity would also enable targeted proteolytic cleavage - editing - of a target protein by designed proteases. Current methods for predicting protease specificity are limited to sequence pattern recognition in experimentally-derived cleavage data obtained for libraries of potential substrates and generated separately for each protease variant. We reasoned that a more semantically rich and robust model of protease specificity could be developed by incorporating the three-dimensional structure and energetics of molecular interactions between protease and substrates into machine learning workflows. We present Protein Graph Convolutional Network (PGCN), which develops a physically-grounded, structure-based molecular interaction graph representation that describes molecular topology and interaction energetics to predict enzyme specificity. We show that PGCN accurately predicts the specificity landscapes of several variants of two model proteases: the NS3/4 protease from the Hepatitis C virus (HCV) and the Tobacco Etch Virus (TEV) proteases. Node and edge ablation tests identified key graph elements for specificity prediction, some of which are consistent with known biochemical constraints for protease:substrate recognition. We used a pre-trained PGCN model to guide the design of TEV protease libraries for cleaving two non-canonical substrates, and found good agreement with experimental cleavage results. Importantly, the model can accurately assess designs featuring diversity at positions not present in the training data. The described methodology should enable the structure-based prediction of specificity landscapes of a wide variety of proteases and the construction of tailor-made protease editors for site-selectively and irreversibly modifying chosen target proteins.


Conflict of interest statement

Competing Interests The authors declare no competing interests.

Figures

Figure 1:
Figure 1:. Architecture of PGCN
A. Peptide substrate (blue) in the binding pocket (yellow) of HCV protease (grey). The 7-residue substrate spans P6 to P1’, with cleavage between P1 and P1’. The logo plot indicates the substrate sequences in the HCV training set, where P1 and P1’ were kept constant, and P6-P2 were variable. B. Molecular depiction of the nodes and edges as a graph. Each substrate (blue) and binding pocket (yellow) amino acid constitutes a node of the graph. Gray lines between pairs of residues denote edges between pairs of nodes. C. PGCN model architecture. Nodes are represented as a matrix of nodes and node features. Edges are represented as a tensor of node pairs and edge features, flattened by the weighted sum of overall edge features. The PGCN model ultimately outputs probabilities of the given substrate belonging to each class, cleaved and uncleaved.
Figure 2:
Figure 2:. PGCN performance.
We evaluate models on six datasets, four consisting of a single HCV variant (WT, A171T, D183A, or Triple (R170K, A171T, D183A)), with various substrates, and two, Combined, one of which pools the other four, and the other consists of 10 TEV variants. A-C) The radar plots show polygon patterns of average test accuracies across three seeds of benchmarked ML models (labeled in different colors) on the five datasets. The highest accuracy is on the polygon periphery. D) Accuracy barplot of models on TEV protease specificity data under different feature settings. Y-axis shows accuracies, truncated from 0.6.
Figure 3.
Figure 3.
Node/edge importance analysis for HCV protease. A) Relative importance of major physical groups of nodes/edges. Node/edge importance is analyzed by the decrease in accuracy upon perturbation normalized by the original test accuracy of the PGCN model trained on each of five HCV protease variants using sequence-only (S), energy-only (E), or both (S+E). All nodes and edges in the PGCN graph are grouped into five major physical groups, and each group’s total relative importance is aggregated as the sum of importance scores from nodes (or edges) of the specified type. B-E) Structural representations of node/edge importance for HCV protease (PDB ID 3M5N; 3M5L), calculated by the energy-only PGCN model trained on B) wild type; C) A171T; D) D183A; E) Triple data. Only nodes/edges whose relative importance scores are within the first 25% quantile are displayed in the zoom-in protease structure (grey), with the substrate (cyan) as the center and the catalytic triad (magenta) as the reference. Among those nodes that meet the criteria, the relative importance levels of protease nodes (orange) are shown by the thickness of corresponding residue side chains, while that of peptide nodes (cyan) is reflected by the sizes of corresponding residue spheres at CB. For those important edges that meet the criteria, different groups are highlighted in different colors, including peptide edges (blue), protease edges (green), and intermolecular edges (yellow). All residues related to node/edge importance have labels in residue identifiers with one-letter codes (colored in red if mutation sites), including protease residues that are only related to edges (violet).
Figure 4.
Figure 4.. Node and edge importance contribution for TEV.
A) Relative importance of major physical groups of nodes/edges. B-E) Partial structural representations of node and edge importance in the context of TEV (PDB ID 1LVB; 1LVM) to show: B) important protease nodes; C) intermolecular edges that presumably form hydrogen bonds; D) the subpocket surrounding P3, including P3-S170, P3-F172, P3-F217; E) the subpocket surrounding P1, including intermolecular edges P1-D148, P1-H167, P1-S170. The same color setting is used as in Figure 3. The catalytic triad in each structure is just the reference of relative position. All mutations are highlighted in red.
Figure 5.
Figure 5.
Pipeline for TEV protease design, including procedures of A) computational design, B) PGCN prediction, and C) yeast-based assay testing using FACS, and D) flow cytometry-based analysis of individual colonies. A) S2 and S6 Pockets corresponding to altered substrate residues were inferred from the crystal structure of a TEV protease-substrate complex, and redesigned using Rosetta. B) Rosetta-generated designs were evaluated using a pre-trained PGCN model and mutations enriched in high-scoring designs were identified and used to generate combinatorial protease libraries. C) These libraries were screened using the YESS assay with P6 and P2 variant substrates, and pools of cells corresponding to cleaved and uncleaved protease:substrate variant pairs were isolated using FACS. D) Individual colonies isolated from cleaved and uncleaved pools were tested using flow cytometry. 2-D scatter plots for positive P2-targeted (top-left) and P6-targeted (top-right) designs and negative designs (P2: bottom-left, P6: bottom-right) are shown. E) Comparison table of PGCN prediction and experimental results on 19 clonally-tested designs.
Figure 6.
Figure 6.. TEV input data variety.
A) TEV protease mutation sites (grey) are shown all together in the TEV wild-type protease structure, located around the substrate (cyan). B) Substrate sequence logos for TEV input data from P6-P1’ positions. X-axis splits data into cleaved (above x-axis) and uncleaved (below x-axis) populations, where the higher frequency of amino acids appeared in the cleaved population, the higher it is located in the logo plot; the lower if considering the uncleaved population. C) Sankey diagram of mutation sites for TEV variants, combined with a horizontal barplot, showing the number of samples for different TEV variants (along x axis). Variants are named based on their mutation sites except for the following four variants: Var1 (T146S_D148P_S153N_S170A_N177M), Var2 (E107D_D127A_S135F_R203Q_K215E), Var3 (T17S_N68D_E107D_D127A_F132L_S135F_F162S_K229E), and L2F. See Table S5 for complete mutation sites in the table.

References

    1. Tang S. et al. Mechanism-based traps enable protease and hydrolase substrate discovery. Nat. 2022 6027898 602, 701–707 (2022). - PMC - PubMed
    1. Erijman A., Aizner Y. & Shifman J. M. Multispecific Recognition: Mechanism, Evolution, and Design. Biochemistry 50, (2011). - PubMed
    1. M, V. et al. Protease Specificity: Towards In Vivo Imaging Applications and Biomarker Discovery. Trends Biochem. Sci. 43, 829–844 (2018). - PubMed
    1. Mason S. D. & Joyce J. A. Proteolytic networks in cancer. Trends Cell Biol. 21, (2011). - PMC - PubMed
    1. Sanman L. E. & Bogyo M. Activity-Based Profiling of Proteases. 10.1146/annurev-biochem-060713-035352 83, 249–273 (2014). - DOI - PubMed

Publication types