[Preprint]. 2023 Feb 16:rs.3.rs-2540186.
doi: 10.21203/rs.3.rs-2540186/v1.

Sleep loss diminishes hippocampal reactivation and replay

Affiliations

Sleep loss diminishes hippocampal reactivation and replay

Bapun Giri et al. Res Sq. .

Update in

Abstract

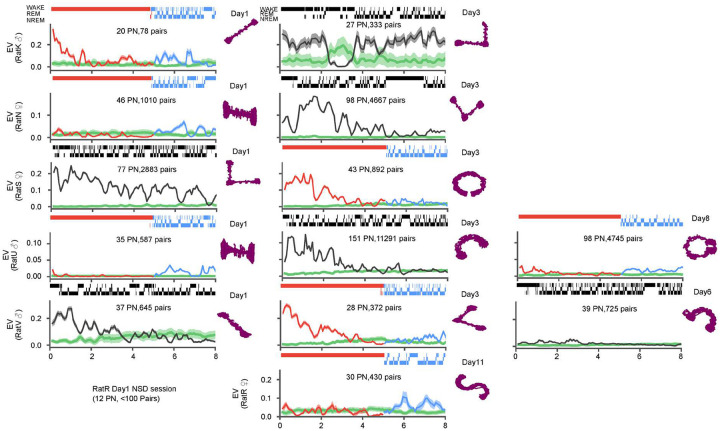
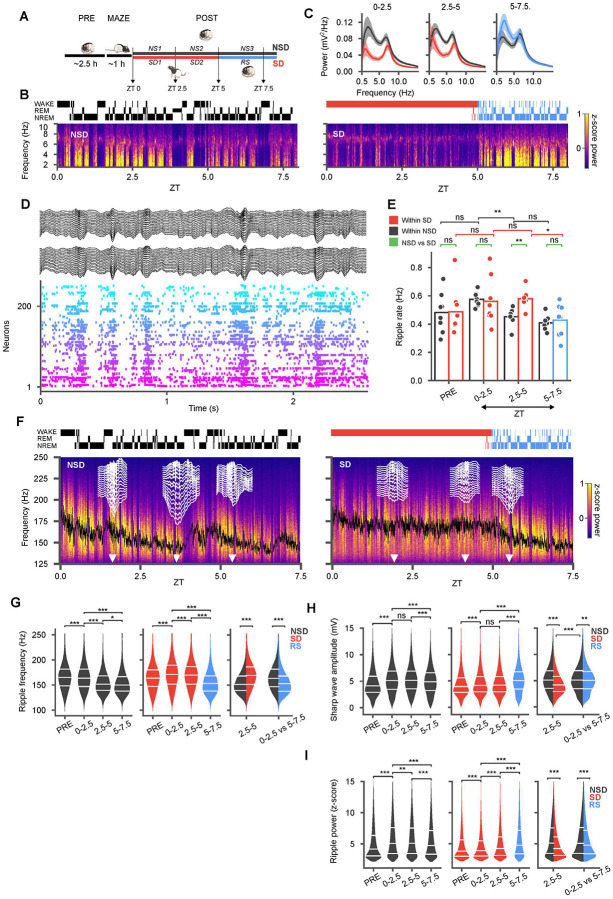
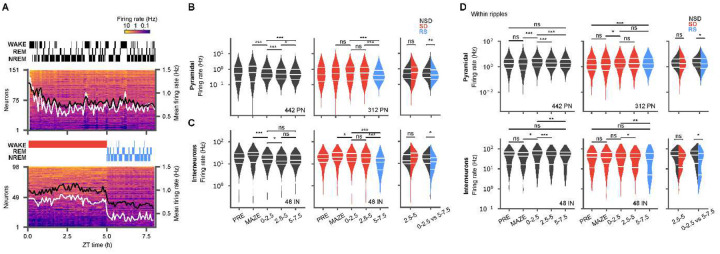
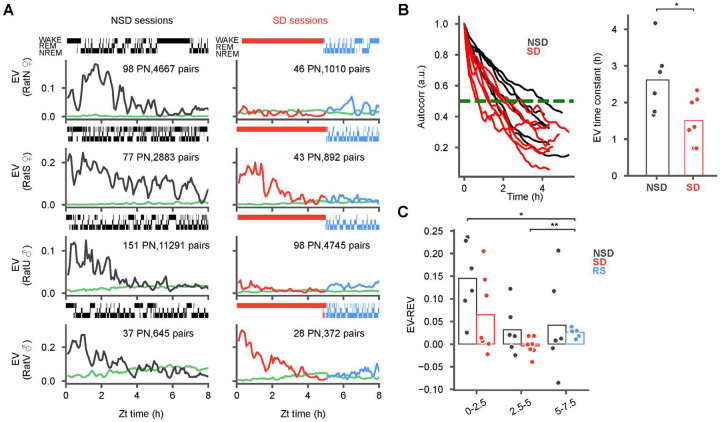
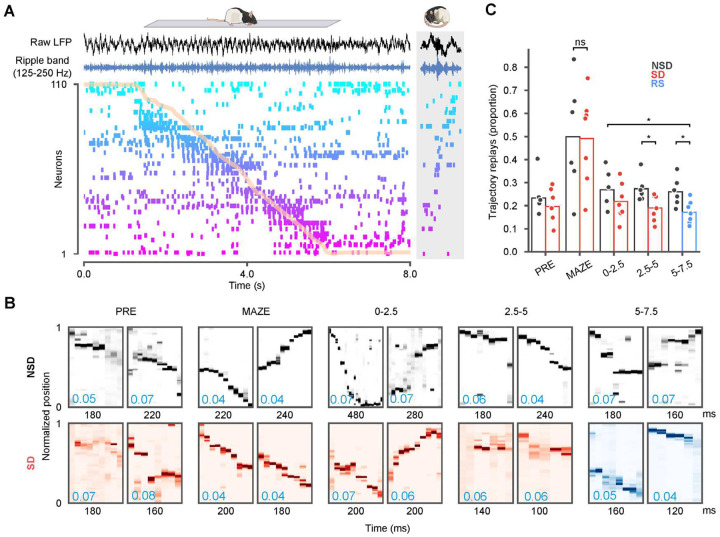
Memories benefit from sleep, and sleep loss immediately following learning has a negative impact on subsequent memory storage. Several prominent hypotheses ascribe a central role to hippocampal sharp-wave ripples (SWRs), and the concurrent reactivation and replay of neuronal patterns from waking experience, in the offline memory consolidation process that occurs during sleep. However, little is known about how SWRs, reactivation, and replay are affected when animals are subjected to sleep deprivation. We performed long duration (~12 h), high-density silicon probe recordings from rat hippocampal CA1 neurons, in animals that were either sleeping or sleep deprived following exposure to a novel maze environment. We found that SWRs showed a sustained rate of activity during sleep deprivation, similar to or higher than in natural sleep, but with decreased amplitudes for the sharp-waves combined with higher frequencies for the ripples. Furthermore, while hippocampal pyramidal cells showed a log-normal distribution of firing rates during sleep, these distributions were negatively skewed with a higher mean firing rate in both pyramidal cells and interneurons during sleep deprivation. During SWRs, however, firing rates were remarkably similar between both groups. Despite the abundant quantity of SWRs and the robust firing activity during these events in both groups, we found that reactivation of neurons was either completely abolished or significantly diminished during sleep deprivation compared to sleep. Interestingly, reactivation partially rebounded upon recovery sleep, but failed to reach the levels characteristic of natural sleep. Similarly, the number of replays were significantly lower during sleep deprivation and recovery sleep compared to natural sleep. These results provide a network-level account for the negative impact of sleep loss on hippocampal function and demonstrate that sleep loss impacts memory storage by causing a dissociation between the amount of SWRs and the replays and reactivations that take place during these events.


Conflict of interest statement

Additional Declarations: There is NO Competing Interest.

Figures

Extended Data Figure 1:
Extended Data Figure 1:. Temporal evolution of reactivation across all recorded sessions.
Reactivation, measured using the explained variance (EV) metric, in thirteen sessions from six different animals (3 male and 3 female), as in Figure 3A. Each row provides session(s) from one animal, with number of putative pyramidal neurons and number of cellpairs used to calculate EV specified inside each panel. Hypnograms above panels depict sleep/wake history, with sleep deprivation/recovery sleep in red/blue and natural sleep in black Animals’ tracked position on the novel tracks (purple) are depicted on the right side of the panels with the day of the recording noted on top
Figure 1:
Figure 1:. Sleep deprivation yields a similar amount of sharp-wave ripples but with lower amplitude sharp waves and higher frequency ripples compared to natural sleep.
(A) After 2.5 h of rest and sleep in the home cage (PRE), animals were introduced to a novel track (MAZE) then returned to the home cage for either undisturbed sleep (NS1 and NS2), or 5h sleep deprivation (SD1 and SD2), followed by recovery sleep (RS). (B) Power spectral density (top right) in sample NSD (left) and SD (right) sessions from one rat with hypnogram (top) and spectrogram (bottom) of bandpass filtered (1–10 Hz) local field potential from CA1. (C) Average power spectral densities across all SD/RS (red/blue with corresponding shaded confidence intervals) and NSD (black with shaded confidence intervals) sessions in different blocks demonstrate suppressed spectral power during SD and a rebound in slow oscillations in RS. (D) Sample recording during sleep with local field potentials from two recording shanks (black, 16 channels each) along with rasters from simultaneously recorded units (arbitrary color and sorting). (E) Rate of ripples in various blocks compared between different NSD (black), SD (red) sessions, and RS (blue). Individual sessions are superimposed as dots over the bar plots. The rate of ripples decreases with sleep but remains elevated during sleep loss. (F) Power spectral densities in the ripple frequency band for the same sessions as in (B) with moving average of ripple frequency superimposed (black). Sample sharp-wave ripples (white traces across a 16-channel shank) at different time points (white arrow heads). (G) Violin plots across NSD (black) and SD/RS (red/blue) blocks show higher frequency of ripples in SD compared to NSD, with an undershoot in RS. Split violins in rightmost panel highlight cross-group comparisons for the second block of NSD vs SD and the first block of sleep (NS1 vs RS) in both groups. (H, I) Same as (G) for sharp-wave amplitude (H) and ripple band power (I) z-scored relative to session means (NSD/SD: each 8 sessions from 7 animals). Sharp-wave amplitudes and ripple power were lower in SD but partially rebounded in RS. (*p < 0.05; ** p < 0.01; *** p < 0.001)
Figure 2:
Figure 2:. Hippocampal firing-rates are elevated and are more dispersed during sleep deprivation.
(A) Two example sessions from non-sleep deprivation (NSD, top) and sleep deprivation (SD, bottom) with recovery sleep (RS), showing mean firing rates of pyramidal units (5 min bins, sorted by mean firing rate) and hypnograms during POST. Mean firing rates (right axis) for pyramidal cells are superimposed (white, this session; black, across all sessions). (B) Violin plots of firing rate distributions for pyramidal neurons during NSD (black; left, n = 7 sessions, 6 animals) and SD/RS (red/blue; middle, n = 8 sessions, 7 animals) in different blocks (PRE, MAZE, ZT 0–2.5, ZT 2.5–5, and ZT 5–7.5) show decreasing firing rates during sleep but elevated and more dispersed firing rates during SD. The total number of cells is noted in the lower right of each panel. Additional comparisons performed (right panel) between the second block of sleep deprivation (SD2) and the comparable period in NSD (NS2), as well as between the first block of sleep in each session, RS vs NS1, show an undershoot in firing during recovery sleep. (C) Same as (B) but for interneurons. (D) Same as (C) but for firing rates restricted to within ripples, demonstrating similar within-ripple firing rates in SD and NSD, but lower rates in RS (Wilcoxon signed rank tests for within group comparisons (left and middle panels), and Wilcoxon rank-sum tests for across group comparisons (right panels), * p < 0.05; ** p < 0.01; *** p < 0.001)
Figure 3:
Figure 3:. Reactivation attenuates during sleep deprivation and is not rescued by recovery sleep.
(A) Explained variance (EV) of pairwise reactivation (NSD, black; SD, red) and its reverse (REV, green) during POST in natural sleep (NSD; left column) and sleep deprivation (SD) with recovery sleep (RS; right column) sessions from 4 animals (sex indicated on the y-axis). Shaded regions indicate low standard deviations. Additional sessions are provided in Extended Data Figure 1. NSD sessions feature robust reactivation lasting for hours while SD sessions show either some (rats S and V) or almost reactivation (rats N and U). (B) The EV auto-correlation (left panel) and corresponding time constants (right panel) derived from the half maxima (NSD: 5 animals, 6 sessions; SD: 6 animals, 7 sessions) demonstrate significantly faster decay in SD vs NSD. (C) Difference of EV and REV were calculated at ZT 0–2.5, ZT 2.5–5 and ZT 5–7.5, with markers for individual sessions superimposed. Note the significant increase between SD2 and RS, but significantly lower RS compared to NS1. (Wilcoxon signed rank tests for within group comparisons (panel C), and Wilcoxon rank-sum tests for across group comparisons (panel B) *p < 0.05)
Figure 4:
Figure 4:. Trajectory replays deteriorate over sleep deprivation and recovery sleep.
(A) Hippocampal spike raster and local field (LFP) during a sample run on the track (normalized track position overlaid in orange). Each row provides spike times for a single neuron, ordered by place field location. Raw LFP (black) and ripple-band filtered traces (blue) from one electrode are shown above the raster. The gray box on the right provides a sample replay sequence from POST sleep. (B) Two example trajectory replays shown for each of the PRE, MAZE, 0–2.5, 2.5–5, and 5–7.5 epochs. In each epoch, the sample events shown had traversed distances in the top 10 percentile and mean jump distance (blue text, lower left) across sequentially decoded bins in the lowest 10 percentile. (C) The proportion of candidate ripple events in different sleep (NSD) or sleep deprivation (SD) and recovery sleep (RS) epochs that decoded continuous trajectories. SD sessions featured significantly fewer trajectory replays by the second block. The proportion of replays in recovery sleep was significantly lower than the equivalent period in natural sleep (Wilcoxon rank-sum tests, *p < 0.05)

References

    1. Rasch B. & Born J. About sleep’s role in memory. Physiol Rev 93, 681–766 (2013). - PMC - PubMed
    1. Havekes R. & Abel T. The tired hippocampus: the molecular impact of sleep deprivation on hippocampal function. Curr Opin Neurobiol 44, 13–19 (2017). - PMC - PubMed
    1. Eschenko O., Ramadan W., Molle M., Born J. & Sara S.J. Sustained increase in hippocampal sharp-wave ripple activity during slow-wave sleep after learning. Learn Mem 15, 222–228 (2008). - PMC - PubMed
    1. Girardeau G., Benchenane K., Wiener S.I., Buzsaki G. & Zugaro M.B. Selective suppression of hippocampal ripples impairs spatial memory. Nat Neurosci 12, 1222–1223 (2009). - PubMed
    1. Gridchyn I., Schoenenberger P., O’Neill J. & Csicsvari J. Assembly-Specific Disruption of Hippocampal Replay Leads to Selective Memory Deficit. Neuron 106, 291–300 e296 (2020). - PubMed

Publication types

LinkOut - more resources