[Preprint]. 2023 Mar 21:2023.02.13.528343.
doi: 10.1101/2023.02.13.528343.

Reproducible evaluation of transposable element detectors with McClintock 2 guides accurate inference of Ty insertion patterns in yeast

Affiliations

Reproducible evaluation of transposable element detectors with McClintock 2 guides accurate inference of Ty insertion patterns in yeast

Jingxuan Chen et al. bioRxiv. .

Update in

Abstract

Background: Many computational methods have been developed to detect non-reference transposable element (TE) insertions using short-read whole genome sequencing data. The diversity and complexity of such methods often present challenges to new users seeking to reproducibly install, execute, or evaluate multiple TE insertion detectors.

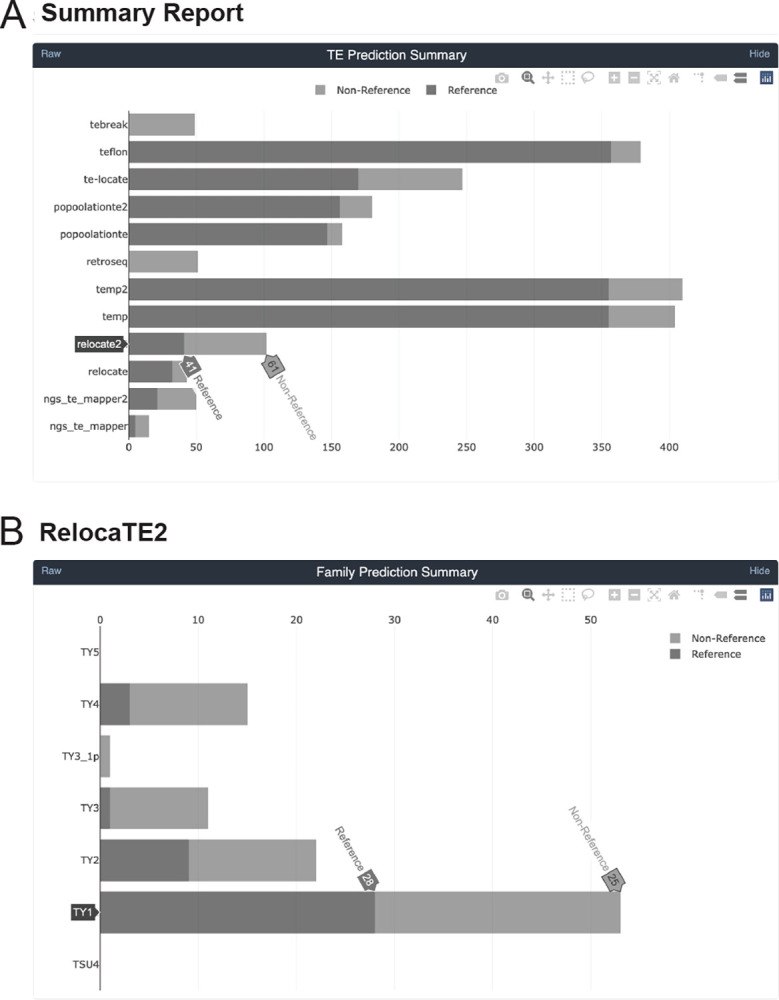
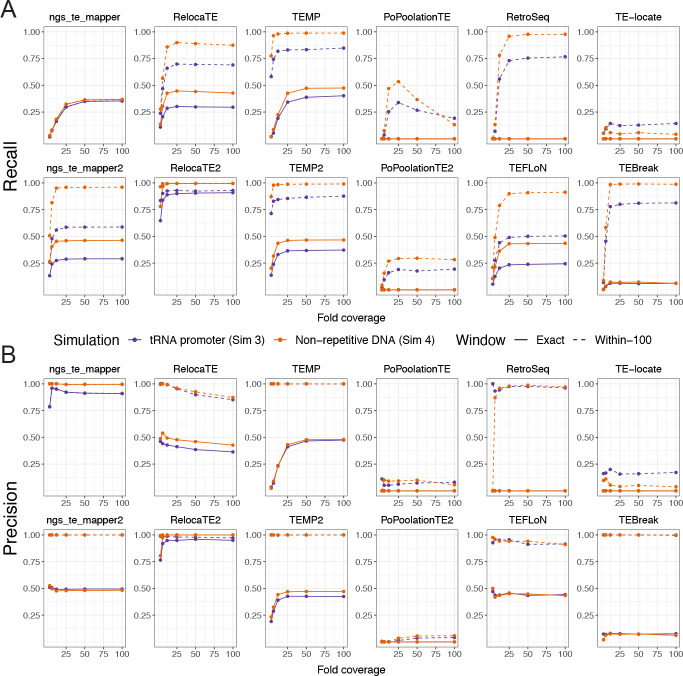
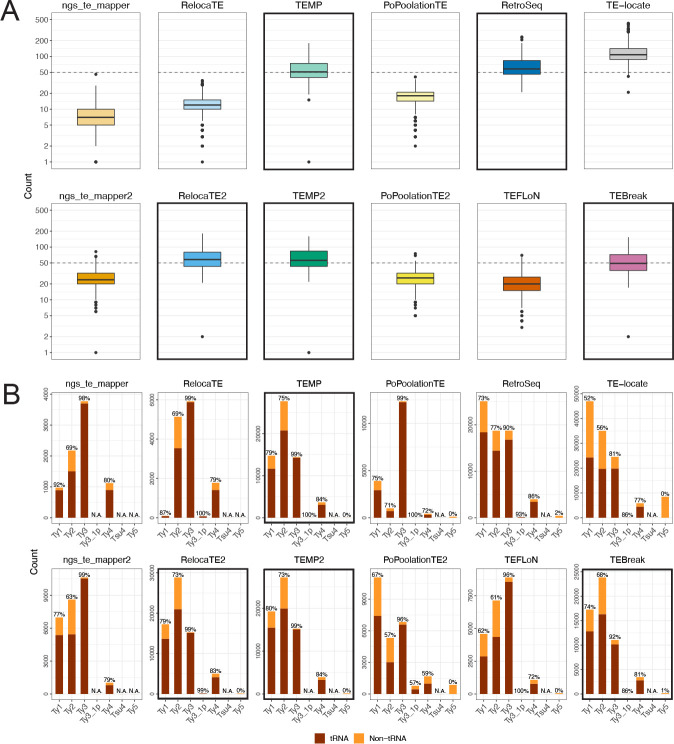
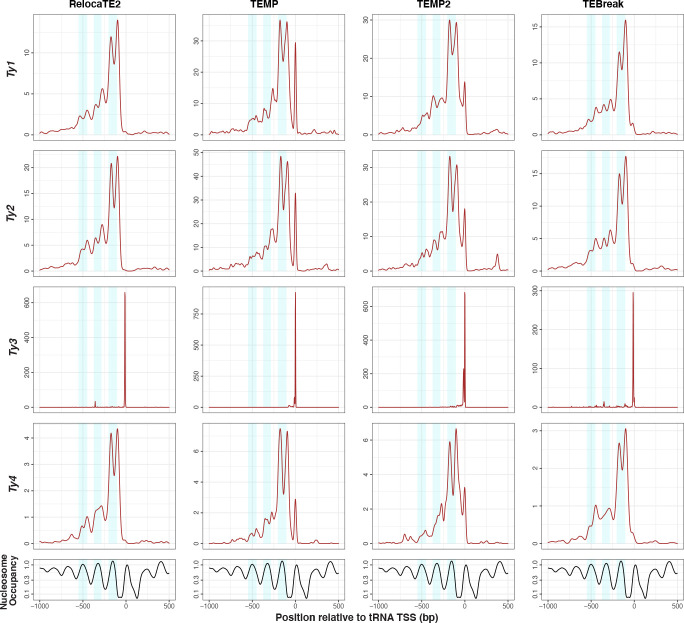
Results: We previously developed the McClintock meta-pipeline to facilitate the installation, execution, and evaluation of six first-generation short-read TE detectors. Here, we report a completely re-implemented version of McClintock written in Python using Snakemake and Conda that improves its installation, error handling, speed, stability, and extensibility. McClintock 2 now includes 12 short-read TE detectors, auxiliary pre-processing and analysis modules, interactive HTML reports, and a simulation framework to reproducibly evaluate the accuracy of component TE detectors. When applied to the model microbial eukaryote Saccharomyces cerevisiae, we find substantial variation in the ability of McClintock 2 components to identify the precise locations of non-reference TE insertions, with RelocaTE2 showing the highest recall and precision in simulated data. We find that RelocaTE2, TEMP, TEMP2 and TEBreak provide a consistent and biologically meaningful view of non-reference TE insertions in a species-wide panel of ∼1000 yeast genomes, as evaluated by coverage-based abundance estimates and expected patterns of tRNA promoter targeting. Finally, we show that best-in-class predictors for yeast have sufficient resolution to reveal a dyad pattern of integration in nucleosome-bound regions upstream of yeast tRNA genes for Ty1, Ty2, and Ty4, allowing us to extend knowledge about fine-scale target preferences first revealed experimentally for Ty1 to natural insertions and related copia-superfamily retrotransposons in yeast.

Conclusion: McClintock (https://github.com/bergmanlab/mcclintock/) provides a user-friendly pipeline for the identification of TEs in short-read WGS data using multiple TE detectors, which should benefit researchers studying TE insertion variation in a wide range of different organisms. Application of the improved McClintock system to simulated and empirical yeast genome data reveals best-in-class methods and novel biological insights for one of the most widely-studied model eukaryotes and provides a paradigm for evaluating and selecting non-reference TE detectors for other species.


Conflict of interest statement

Competing interests

The authors declare that they have no competing interests.

Figures

Figure 1
Figure 1. Sample screenshots from the new interactive HTML report in McClintock 2.
The HTML report generates summary information for the McClintock run including interactive bar plots for: (A) the number of reference, non-reference, and total number of predictions made across all TE families by all 12 component methods; and (B) the number of reference, non-reference, and total number of predictions made for a specific component method (e.g., RelocaTE2). Barplots from the report shown were generated by a complete McClintock run (revision d2b819a18b2a549be483fdcc948e1346e589a4cb) applied to Illumina 101-bp paired-end sequences for S. cerevisiae strain YJM1460 (SRA: SRR800842), down-sampled to 50× fold-coverage.
Figure 2
Figure 2. McClintock 2 re-implementation improves CPU efficiency and run time on multi-core architectures.
Shown are average (A) CPU efficiency and (B) run times across 5 replicates of McClintock 1 (six component methods, orange line) or McClintock 2 (same six component methods as for McClintock 1, light blue line; all 12 component methods in McClintock 2, dark blue line) applied to 50× and 100× Illumina 101-bp paired-end sample for S. cerevisiae strain YJM1460 (SRA: SRR800842). Error bars indicate standard deviations across replicates. To allow compatibility with McClintock 1, all runs were performed on unzipped, untrimmed fastq files and thus run times do not include these processes.
Figure 3
Figure 3. Performance of McClintock 2 component methods in simulated yeast WGS data.
Shown are the (A) recall and (B) precision across different fold-coverage for individual compnent methods to detect single synthetic insertions in an otherwise unmodified S. cerevisiae reference genome. Purple lines (Simulation 3) model the biologically realistic insertion preferences of yeast TEs, with synthetic Ty insertions created upstream of tRNA genes in regions that often have fragments of prior TE insertions in the reference genome. Orange lines (Simulation 4) model random insertions in non-repetitive regions, which allows insight into the effects of insertion within repetitive DNA and component’s performance for organisms without strong TE targeting preferences. Points indicate tested fold-coverage configurations, i.e, 3×, 6×, 12×, 25×, 50× and 100×. Solid lines represent performance estimates for non-reference TE predictions made at the exact site of the synthetic insertion. Dashed lines represent performance estimates for non-reference TE predictions made within 100 bp surrounding the synthetic insertion site. The six original component methods in McClintock 1 are on the top row of each panel, and the six new methods in McClintock 2 are on the second row of each panel.
Figure 4
Figure 4. Numbers of Ty elements predicted by McClintock 2 components in a world-wide sample of yeast strains.
(A) Numbers of non-reference TE predictions per strain (summed over all Ty families) and (B) numbers of non-reference TE predictions across Ty families (summed over all strains) in 1,011 S. cerevisiae WGS samples [63, 65], down-sampled to 50× fold-coverage. In panel (A), lines inside boxes indicate median values, colored boxes show interquartile ranges (IQR), whiskers show values 1.5×IQR of the upper or lower quartiles, and the dots indicate outliers that beyond 1.5×IQR. Components with bold outlines in panel (A) have have median values of ~50 non-reference Ty insertions per strain (dashed lines), as well as recall and precision both >75% in tRNA promoter insertion simulations when allowing non-exact predictions in WGS datasets with >50× coverage (see Fig. 3). We note that the y-axis is on a log10 scale, and that 16 zero-count data points and one extreme TE-locate data point (count=749) is removed to aid with visualization. In panel (B) total numbers of non-reference TE predictions are partitioned as “tRNA” (dark red) if they are located between 1000 bp upstream and 500 bp downstream of tRNA genes, or “non-tRNA” (orange) if outside these windows. Note that the y-scale varies for each component method. The percentage of near tRNA gene predictions is annotated at the top of each bar. “N.A.” means no such Ty family was found using that component. Components with bold outlines in panel (B) predict consistent relative TE family abundance and also have properties of components with bold outlines in panel (A), and thus we designate them as “best-in-class” methods for predicting non-reference TE insertions in S. cerevisiae.
Figure 5
Figure 5. copia-superfamily retrotransposons show a dyad pattern of insertion in nucleosome-bound regions upstream of yeast tRNA genes.
The top four rows show density profiles of non-redundant insertion sites for non-reference Ty predictions made by best-in-class McClintock 2 components (RelocaTE2, TEMP, TEMP2 and TEBreak) in tRNA promoter regions in a panel of 1,011 S. cerevisiae WGS samples [63, 65], down-sampled to 50× fold-coverage. Only the four Ty familes (Ty1, Ty2, Ty3 and Ty4) that are know to non-randomly target tRNA genes are included in this analysis. The bottom row shows nucleosome occupancy inferred using MNase-seq data from [68]. Light blue shaded areas indicate 100-bp regions surrounding peaks of nucleosome occupancy.

Similar articles

References

    1. Bourque G., Burns K.H., Gehring M., Gorbunova V., Seluanov A., Hammell M., Imbeault M., Izsvák Z.,Levin H.L., Macfarlan T.S., Mager D.L., Feschotte C.: Ten things you should know about transposable elements. Genome Biol 19(1), 199 (2018). doi:10.1186/s13059-018-1577-z - DOI - PMC - PubMed
    1. Biemont C., Monti-Dedieu L., Lemeunier F.: Detection of transposable elements in Drosophila salivary gland polytene chromosomes by in situ hybridization. Methods Mol Biol 260, 21–28 (2004). doi:10.1385/1-59259-755-6:021 - DOI - PubMed
    1. Yu W., Lamb J.C., Han F., Birchler J.A.: Cytological visualization of DNA transposons and their transposition pattern in somatic cells of maize. Genetics 175(1), 31–39 (2007). doi:10.1534/genetics.106.064238 - DOI - PMC - PubMed
    1. Bergman C.M., Quesneville H.: Discovering and detecting transposable elements in genome sequences. Brief Bioinformatics 8(6), 382–92 (2007). doi:10.1093/bib/bbm048 - DOI - PubMed
    1. Saha S., Bridges S., Magbanua Z.V., Peterson D.G.: Computational approaches and tools used in identification of dispersed repetitive DNA sequences. Tropical Plant Biol 1(1), 85–96 (2008). doi:10.1007/s12042-007-9007-5 - DOI

Publication types