[Preprint]. 2023 Feb 17:rs.3.rs-2587773.
doi: 10.21203/rs.3.rs-2587773/v1.

Context-dependent activation of a social behavior brain network associates with learned vocal production

Affiliations

Context-dependent activation of a social behavior brain network associates with learned vocal production

Katherine L Anderson et al. Res Sq. .

Update in

Abstract

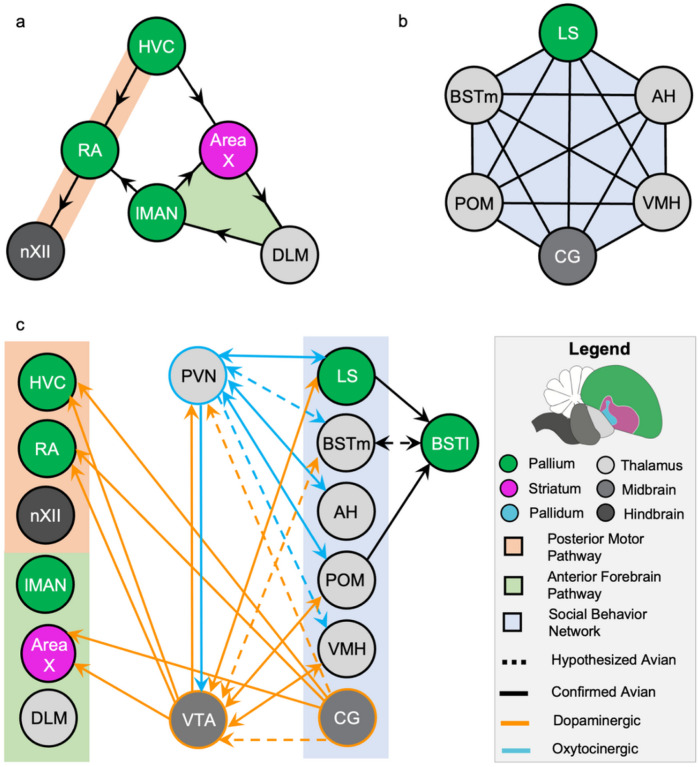
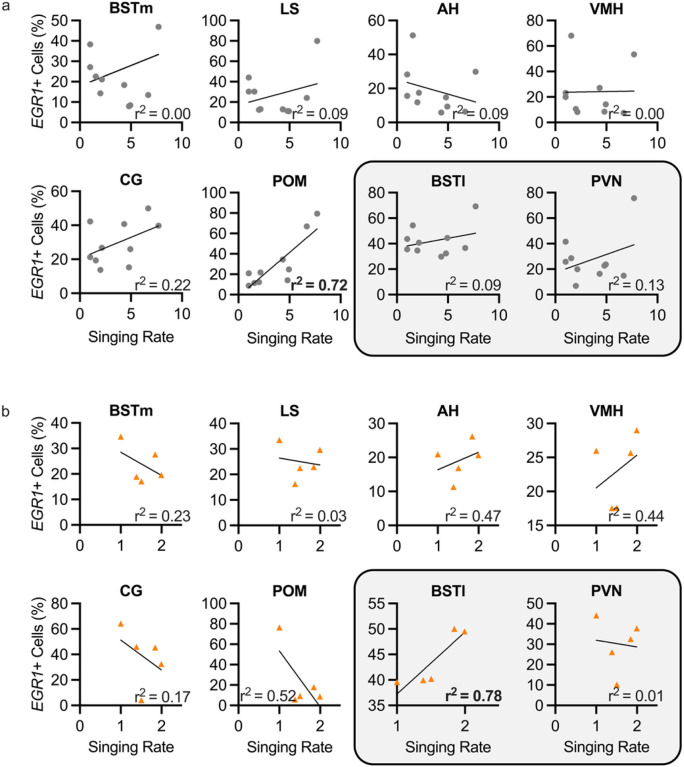
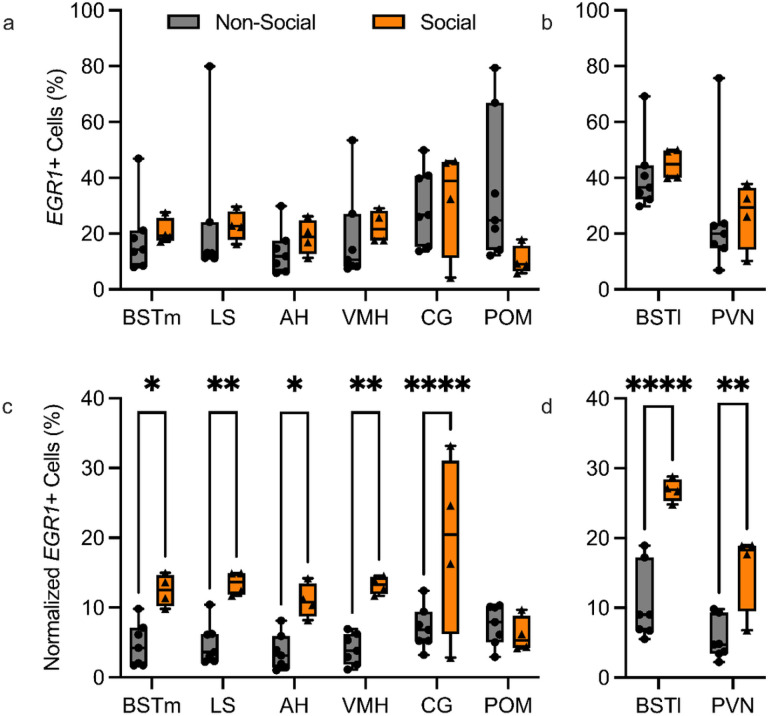
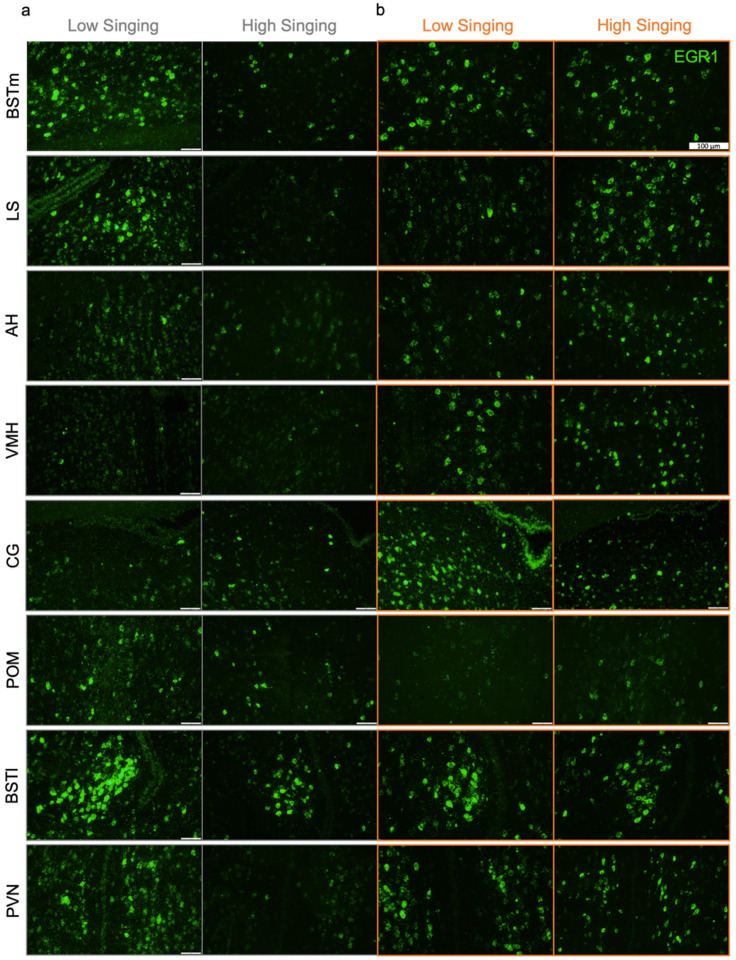
In zebra finches, an avian brain network for vocal control undergoes context-dependent patterning of song-dependent activation. Previous studies in zebra finches also implicate the importance of dopaminergic input in producing context-appropriate singing behavior. In mice, it has been shown that oxytocinergic neurons originated in the paraventricular nucleus of the hypothalamus (PVN) synapse directly onto dopamine neurons in the ventral tegmental area (VTA), implicating the necessity of oxytocin signaling from the PVN for producing a context-appropriate song. Both avian and non-avian axonal tract-tracing studies indicate high levels of PVN innervation by the social behavior network. Here, we hypothesize that the motivation for PVN oxytocin neurons to trigger dopamine release originates in the social behavior network, a highly conserved and interconnected collection of six regions implicated in various social and homeostatic behaviors. We found that expression of the neuronal activity marker EGR1 was not strongly correlated with song production in any of the regions of the social behavior network. However, when EGR1 expression levels were normalized to the singing rate, we found significantly higher levels of expression in the social behavior network regions except the medial preoptic area during a social female-directed singing context compared to a non-social undirected singing context. Our results suggest neuronal activity within the male zebra finch social behavior network influences the synaptic release of oxytocin from PVN onto dopaminergic projection neurons in the VTA, which in turn signals to the vocal control network to allow for context-appropriate song production.


Conflict of interest statement

Competing Interests

The authors have no relevant financial or non-financial conflicts of interest to disclose.

Figures

Figure 1
Figure 1
Axonal connections between avian neural networks for vocal learning and production and social behavior. The vocal control network (a) is comprised of two interconnected pathways: the posterior motor pathway (orange background; HVC, RA, and nXII) and the anterior forebrain pathway (green background; Area X, lMAN, and DLM). The social behavior network (b) is comprised of six interconnected regions (blue background; LS, BSTm, AH, POM, VMH, and CG). The brain area each region is located within is demonstrated by the color of the circle surrounding the region name, color key, and relative locations of each region are shown in the figure legend (green is pallium, pink is striatum, light gray is thalamus, medium gray is midbrain, and dark gray is hindbrain). In avian species, the social behavior network has direct and indirect connections to the vocal control network. These connections primarily work through the dopaminergic system (orange arrows), but the involvement of oxytocin is implicated as well (blue arrows). Solid lines represent the results of axonal tract-tracing studies performed in avian species, and dotted lines represent results from non-avian studies that the authors hypothesize are conserved in songbirds. Connections literature outlined in Table 1
Figure 2
Figure 2
Correlations between singing rate and percentage of cellular activation in all regions of the social behavior network (including the BSTl) and the PVN in non-social and social conditions. Percentage of cells expressing EGR1 is plotted against the number of song bouts produced for individual animals in a non-social undirected singing condition (a, gray circles) and a social female-directed singing condition (b, orange triangles) for all regions of the social behavior network (including the BSTl) and the PVN. Low correlations (r2 < 0.52) were seen for all regions in non-social and social contexts except for the POM in non-social singing contexts and the BSTl in social singing contexts, which had r2 values of 0.7221 and 0.7794, respectively. Significant r2 values are bolded
Figure 3
Figure 3
Cellular activation within each region of the social behavior network (including the BSTl) and the PVN in non-social and social conditions. Cellular activation is plotted both unnormalized (a & b) and normalized to singing rate (c & d). No significant differences were found for unnormalized cellular activation in non-social (gray bars, circle icons, n=10) versus social (orange bars, triangle icons, n=4) singing conditions. After normalization to the singing rate, all regions except the POM showed higher levels of cellular activation in social singing conditions compared to non-social singing conditions. Each icon represents an individual animal, and each region was analyzed in every animal included within a single context. *= p-value < 0.05, ** = p-value < 0.01, *** = p-value < 0.001, **** = p-value < 0.0001
Figure 4
Figure 4
Representative fluorescent in situ hybridization images for all regions of the social behavior network (including the BSTl) and the PVN in non-social and social conditions. 40X fluorescent images are presented for adult male zebra finches performing low (under one bout per minute) and high (over one bout per minute) singing amounts in non-social undirected (a) and social female-directed (b) contexts. Counts were performed only in regions of interest and did not include cells from surrounding brain areas. Region boundaries were hand drawn based on borders shown in previous literature. Scale bar represents 100 μm

Similar articles

References

    1. Absil P, Papello M, Viglietti-Panzica C, et al. (2002) The medial preoptic nucleus receives vasotocinergic inputs in male quail: a tract-tracing and immunocytochemical study. J Chem Neuroanat 24:27–39. 10.1016/s0891-0618(02)00017-0 - DOI - PubMed
    1. Alger SJ, Riters LV (2006) Lesions to the medial preoptic nucleus differentially affect singing and nest box-directed behaviors within and outside of the breeding season in European starlings (Sturnus vulgaris). Behav Neurosci 120:1326–1336. 10.1037/0735-7044.120.6.1326 - DOI - PMC - PubMed
    1. Appeltants D, Absil P, Balthazart J, Ball GF (2000) Identification of the origin of catecholaminergic inputs to HVc in canaries by retrograde tract tracing combined with tyrosine hydroxylase immunocytochemistry. J Chem Neuroanat 18:117–133. 10.1016/s0891-0618(99)00054-x - DOI - PubMed
    1. Appeltants D, Ball GF, Balthazart J (2002) The origin of catecholaminergic inputs to the song control nucleus RA in canaries. Neuroreport 13:649–653. 10.1097/00001756-200204160-00023 - DOI - PubMed
    1. Aransay A, Rodríguez-López C, García-Amado M, et al. (2015) Long-range projection neurons of the mouse ventral tegmental area: a single-cell axon tracing analysis. Front Neuroanat 9:59. 10.3389/fnana.2015.00059 - DOI - PMC - PubMed

Publication types

LinkOut - more resources