[Preprint]. 2023 Feb 15:2023.02.14.528376.
doi: 10.1101/2023.02.14.528376.

Human gene regulatory evolution is driven by the divergence of regulatory element function in both cis and trans

Affiliations

Human gene regulatory evolution is driven by the divergence of regulatory element function in both cis and trans

Tyler Hansen et al. bioRxiv. .

Update in

Abstract

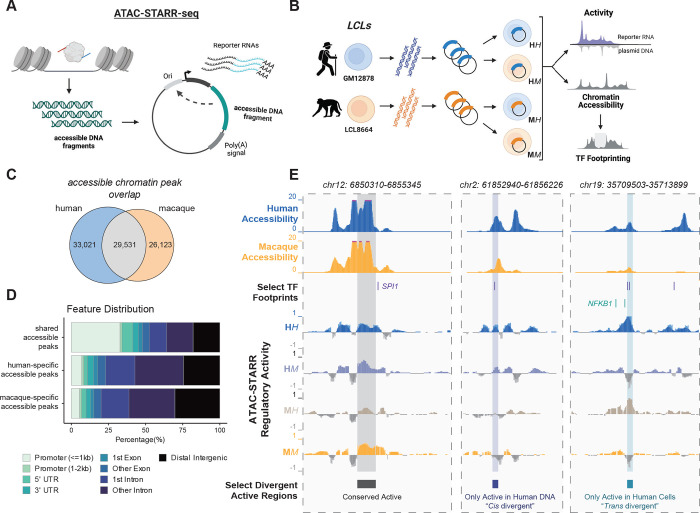
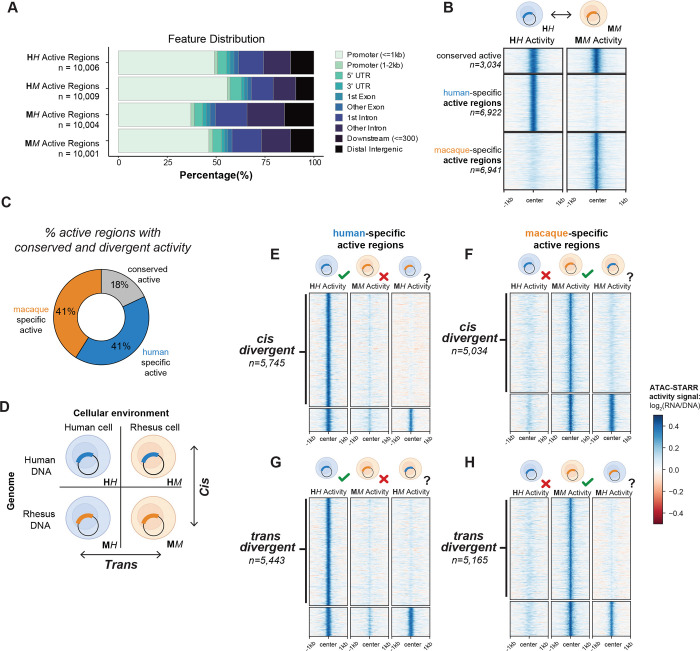
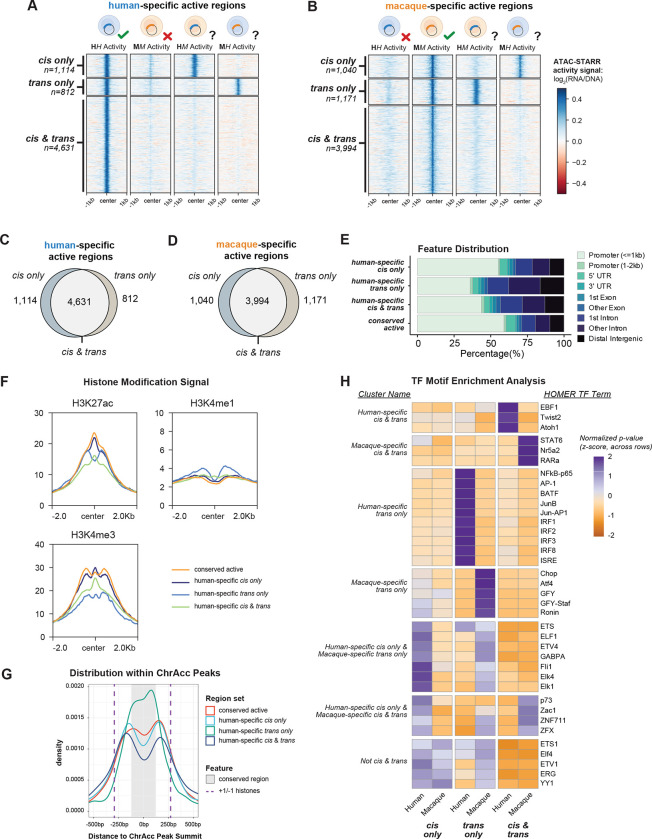
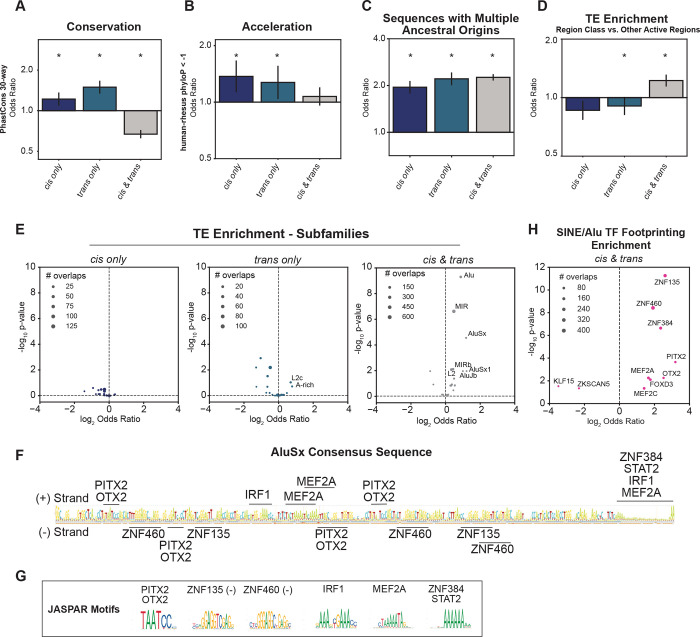
Gene regulatory divergence between species can result from cis-acting local changes to regulatory element DNA sequences or global trans-acting changes to the regulatory environment. Understanding how these mechanisms drive regulatory evolution has been limited by challenges in identifying trans-acting changes. We present a comprehensive approach to directly identify cis- and trans-divergent regulatory elements between human and rhesus macaque lymphoblastoid cells using ATAC-STARR-seq. In addition to thousands of cis changes, we discover an unexpected number (~10,000) of trans changes and show that cis and trans elements exhibit distinct patterns of sequence divergence and function. We further identify differentially expressed transcription factors that underlie >50% of trans differences and trace how cis changes can produce cascades of trans changes. Overall, we find that most divergent elements (67%) experienced changes in both cis and trans, revealing a substantial role for trans divergence-alone and together with cis changes-to regulatory differences between species.

Keywords: Comparative Genomics; DNA Regulatory Elements; Functional Genomics; Gene Regulation; Human Evolution; Lymphoblastoid Cell Lines; Massively Parallel Reporter Assays.


Conflict of interest statement

DECLERATIONS OF INTEREST The authors declare no competing interests.

Figures

Figure 1:
Figure 1:. Comparative ATAC-STARR-seq produces a multi-layered view of human and macaque gene regulatory divergence.
(A) A schematic of the ATAC-STARR-seq methodology. Accessible DNA fragments are isolated from cells and subsequently cloned into a self-transcribing reporter vector plasmid, which are then electroporated into cells and assayed for regulatory activity by harvesting and sequencing Reporter RNAs and input plasmid DNA. (B) Our comparative ATAC-STARR-seq strategy to assay human and macaque genomes in both cellular environments. ATAC-STARR-seq plasmid libraries were independently generated for GM12878 and LCL8664 cell lines and then assayed separately in either cellular context. Our comparative approach provides measures in chromatin accessibility and transcription factor (TF) footprinting for both genomes as well as regulatory activity for the four experimental conditions: human DNA in human cells (HH), human DNA in macaque cells (HM), macaque DNA in human cells (MH) and macaque DNA in macaque cells (MM). (C) Euler plot representing the number of species-specific and shared accessibility peaks identified from ATAC-STARR-seq data. (D) Distribution of genomic annotations for species-specific and shared accessibility peaks based on the distance to nearest transcription start site. (E) Select genomic loci at hg38 coordinates representing conserved or differentially active regions of the two genomes. Tracks represent human and rhesus macaque accessibility, TF footprints for SPI1 and NFKB1, and regulatory activity measures for HH, HM, MH, MM. See also Figure S1.
Figure 2:
Figure 2:. Cis and trans gene regulatory divergence occur at similar frequencies.
(A) Distribution of genomic annotations for the ~10,000 active regions called in each condition based on the distance to nearest transcription start site. (B) Comparison between the human and macaque native states to reveal conserved and species-specific active regions. (C) The percentage of active regions with conserved and divergent activity. (D) Cartoon depicting the four conditions tested and how they are compared to identify cis and trans divergent regions. (E) Human-specific cis divergent regions determined by comparing human-specific active regions with the MH condition. Regions without MH activity were called cis divergent regions. (F) Macaque-specific cis divergent regions determined by comparing human-specific active regions with the HM condition. (G) Human-specific trans divergent regions determined by comparing human-specific active regions with the HM condition. (H) Macaque-specific trans divergent regions determined by comparing human-specific active regions with the HM condition. The heatmaps display ATAC-STARR-seq activity values for the specified region sets and experimental conditions. See also Figure S2.
Figure 3:
Figure 3:. Most species-specific regulatory differences are driven by changes in both cis and trans.
(A,B) Comparison of ATAC-STARR-seq activity values across all conditions for (A) human-specific and (B) macaque-specific cis and trans divergent regions. Cis only, trans only, and cis & trans regions display activity signals consistent with their calls. (C,D) Euler plots of the cis only, trans only, and cis & trans classifications for (C) human-specific and (D) macaque-specific active regions. (E) Distribution of genomic annotations for human-specific cis only, trans only, cis & trans, and conserved active regions. (F) Profile plots of ENCODE GM12878 ChIP-seq signal for H3K27ac, H3K4me1, and H3K4me3 histone modifications for the human-specific region classes. (G) Density plot of the distances between region center and accessible chromatin (ChrAcc) peak summits for human-specific cis only, trans only, cis & trans, and conserved active regions. The +1 and −1 histones are estimated with purple dashed lines by the ENCODE GM12878 H3K27ac signal summits and the conserved portion of the ChrAcc peaks is estimated with a grey box by the 17-way PhyloP score, see Figure S3C,D. (H) Clustered heatmap of TF motif enrichments for the combined or species separated cis only, trans only, cis & trans regions. Values are the z-score distributions of p-values, normalized across rows. Only the top 15 motifs for each region set were chosen for plotting. See also Figure S3.
Figure 4:
Figure 4:. Trans only regions are bound by differentially expressed TFs.
(A) Volcano plot of differential expression analysis between GM12878 (human) and LCL8664 (macaque) cell lines. Point color represents genes upregulated in human (blue) or macaque (orange). Thresholds were log2 fold-change > | 2 | and padj < 0.001. (B) Enrichments of differentially expressed gene sets for Reactome pathways. Only the top 5 terms in each were plotted. (C) Enrichment of human-specific trans only regions for TF footprints stratified by the differential expression of the TF. Text is only shown for the most differentially expressed and enriched TFs. See Figure S4G for macaque trans only results. (D) Percentage of human-specific trans only regions that overlap a given footprint. TFs within the same motif archetype were merged before determining the number of overlaps. See Figure S4H for macaque trans only results. See also Figure S4.
Figure 5:
Figure 5:. Cis only, trans only, and cis & trans regions have different degrees of conservation, acceleration, and transposable element enrichment.
(A-C) Enrichments of cis only, trans only, and cis & trans regions for (A) 30-way PhastCons elements, (B) human accelerated elements (defined as human-rhesus PhyloP < −1), and (C) sequences with multiple ancestral origins compared to an expected background. (D) Enrichment of divergent regions for transposable element (TE) overlap compared to other active regions. For all bar charts, the Fisher’s Exact Test odds ratio (OR) is plotted with 95% confidence intervals, which were estimated from 10,000 bootstraps. Windows were log2-scaled. Asterisks indicate a 5% FDR p-value < 0.05. (E) Enrichments of cis only, trans only, and cis & trans regions for subfamilies of TEs compared to an expected background. (F) The AluSx consensus sequence with TF binding sites for the TFs with enriched footprints. (G) Jaspar motifs of the relevant TFs. (H) Enrichments of SINE/Alu overlapping cis & trans regions for human TF footprints compared to an expected background. For the scatter plots, text is only shown for the most enriched subfamilies/TFs and point size represents the number of overlaps observed. See also Figure S5.
Figure 6:
Figure 6:. A human accelerated cis only element regulates NLRP1 expression.
(A) Enrichments of cis only, trans only, and cis & trans regions for EBV-transformed B cell eQTLs. The median fold-change compared to the expected background is plotted with 95% confidence intervals, which were estimated from 10,000 bootstraps. The inset in represents EBV-transformed B cell eQTLs enrichments for human-specific cis only, trans only, cis & trans regions. (B) Normalized expression scores of NLRP1 for the three possible genotypes of rs1805264. (C) PhyloP score distribution for cis only and expected shuffled regions compared to the PhyloP score of the chr17: 5,486,721–5,486,861 locus (red dotted line). (D) Genomic locus on Chr17 with a zoomed-in view of a multi-way sequence alignment for a highly accelerated human-specific cis only element. (E) Differential TF footprints between human and macaque coincide with human-accelerated substitutions. (F) Differential expression of rs1805462-associated eQTL genes between human and macaque LCLs. (G) PheWAS associations for rs1805462 with variation in quantitative blood traits. See also Figure S6.
Figure 7:
Figure 7:. A single substitution may drive differential expression of ETS1 by perturbing RUNX3 binding in macaques.
(A) Genomic locus of a human-specific cis only regions within a putative ETS1 enhancer. Public tracks for GM12878 H3K27ac and Human B cell DNA methylation corroborate this region as a putative enhancer. The first zoomed-in view of the locus shows a RUNX3 footprint present in human cells but not macaque cells. Nearby SNPs, rs4262739 and rs4245080, are associated with human trait variation. A further zoomed-in view of the footprint with a multi-species sequence alignment between human, chimpanzee, and macaque to reveal a macaque-specific substitution that perturbs an important nucleotide of the RUNX3 binding motif. (B) ETS1 and RUNX3 transcript per million (TPM) values for each replicate in human and macaque cells. (C) Hi-C data browser view of the ETS1 locus in GM12878 cells. Vertical dashed line represents the relative location of the putative ETS1 enhancer. (D) Model of how cis changes can become trans changes for other loci via TF expression/activity changes. First, cis changes alter the DNA sequence of a regulatory element to alter the affinity of TFs to the locus. This causes either enhancer activity loss or gain, based on the ancestral activity state of the enhancer. Alteration of enhancer activity, in turn, modifies the expression of target genes. If the target gene is a transcriptional regulator, the cis change would, therefore, also alter the cellular environment and become a trans change for other regulatory regions. (E) Model of how regions divergent in both cis & trans jointly drive differential regulatory element activity.

References

    1. King M.C., and Wilson A.C. (1975). Evolution at two levels in humans and chimpanzees. Science 188, 107–116. 10.1126/science.1090005. - DOI - PubMed
    1. Britten R.J., and Davidson E.H. (1969). Gene regulation for higher cells: a theory. Science 165, 349–357. 10.1126/science.165.3891.349. - DOI - PubMed
    1. Britten R.J., and Davidson E.H. (1971). Repetitive and non-repetitive DNA sequences and a speculation on the origins of evolutionary novelty. Q Rev Biol 46, 111–138. 10.1086/406830. - DOI - PubMed
    1. Franchini L.F., and Pollard K.S. (2017). Human evolution: the non-coding revolution. BMC Biol 15, 89. 10.1186/s12915-017-0428-9. - DOI - PMC - PubMed
    1. Sholtis S.J., and Noonan J.P. (2010). Gene regulation and the origins of human biological uniqueness. Trends Genet 26, 110–118. 10.1016/j.tig.2009.12.009. - DOI - PubMed

Publication types