. 2023 Feb 14:2023:3077091.
doi: 10.1155/2023/3077091. eCollection 2023.

Deciphering the Role of Melatonin-Related Signatures in Tumor Immunity and the Prognosis of Clear Cell Renal Cell Carcinoma

Affiliations

Deciphering the Role of Melatonin-Related Signatures in Tumor Immunity and the Prognosis of Clear Cell Renal Cell Carcinoma

Aimin Jiang et al. Oxid Med Cell Longev. .

Abstract

Methods: Adopting multiomics data from TCGA and other public datasets, we analysed the expression, mutation, and prognostic evaluation in multiple cancers. ccRCC patients were categorized into two subgroups by an unsupervised cluster algorithm: melatonin-pattern cancer subtype 1 (MPCS1) and subtype 2 (MPCS2). We then explored the immune microenvironment, immune therapy response, and tumor metabolic pathways between the two subtypes. The clinical characteristics, genomic mutation landscape, and molecular inhibitor response were further investigated. Finally, a melatonin regulator-related prognostic model was constructed to predict patient prognosis in ccRCC.

Results: We found that melatonin regulators were dysregulated depending on distinct cancer types, which were associated with genomic variation. The two subtypes indicated different clinical characteristics and biological processes in ccRCC. MPCS2, an aggressive subtype, led an advanced clinical stage and poorer survival of ccRCC patients. The activated oncogenic signaling pathway and metabolic signatures were responsible for cancer progression in the MPCS2 subtype. The MPCS2 subgroup suggested a higher tumor mutational burden and immune dysfunction state, resulting in a lower response to immunotherapy. The copy number variations of MPCS2 were significantly more frequent than those of MPCS1. In addition, the two subgroups exhibited distinct drug responsiveness, with MPCS2 being less responsive to multiple drugs. Finally, we established a subtype biomarker-based prognostic risk model that exhibited satisfactory performance in ccRCC patients.

Conclusion: Melatonin regulator-related features could remodel functional pathways and the tumor immune microenvironment through genomic mutations and pathway regulation. Melatonin regulator-associated molecular subtypes enhance the understanding of the molecular characteristics of renal cancer and can guide clinical treatment. Activating the melatonergic system axis may improve the effect of immunotherapy for ccRCC.


Conflict of interest statement

The authors report that there are no competing interests to declare.

Figures

Figure 1
Figure 1
Dysregulation and mutation profile of melatonin-associated regulators across cancers. (a) The relative gene expression of melatonin-associated regulators. (b) The impact of melatonin-associated regulators on patient survival. (c) The correlation of CNV and the gene expression level of melatonin-associated regulators. (d) Heterozygous amplification or deletion of melatonin-associated regulators. (e) The genome locations of melatonin-associated regulators.
Figure 2
Figure 2
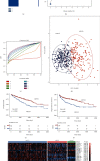
Identification of two clusters based on melatonin-related signatures. (a) Consensus cluster matrix of melatonin-related regulators in TCGA-KIRC. (b) The proportion of ambiguous clustering scores illustrating the optimal number of clusters. (c) CDF curves of the hierarchical model. (d) Two-dimensional principal component plot based on melatonin regulators. The blue dots represent MPCS1, and the red dots represent MPCS2. (e, f) Survival analysis of OS and PFS. (g) Heatmap of the expression of melatonin regulators in MPCS1, MPCS2, and normal tissues.
Figure 3
Figure 3
Various functional enrichment analyses of ccRCC subtypes. (a) Volcano plot indicating DEGs. (b) GO enrichment analysis of cellular component. (c) KEGG, (d) GSEA, and (e) GSVA between subtypes. (f) Regulation scores of different transcription factors. Yellow represents activated expression of transcription factors. Blue represents repressed expression of transcription factors.
Figure 4
Figure 4
Immune profiling between subtypes. (a, b) Heatmap indicating the different immune signatures and immune component enrichment between subtypes.
Figure 5
Figure 5
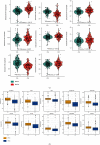
Landscapes of specific immune components and immune function scores for both subtypes. (a) ESTIMATE scores between MPCS1 and MPCS2. (b–d) The immune checkpoint inhibitors, normalized enrichment scores of immune effectors, and anticancer immune steps between MPCS1 and MPCS2. (e) EHN, MSI, HRD, dysfunction, and TIDE score between MPCS1 and MPCS2.
Figure 6
Figure 6
Profiles of somatic mutations between the two subtypes. (a) Mutational landscape. (b) Forest plot showing the prognostic impact of mutated signatures. (c) Potential druggable categories. (d) Comutation and coexisting mutation pattern. (e) Oncogenic signaling pathways in MPCS1 and MPCS2.
Figure 7
Figure 7
CNV of the two subtypes. (a) Comparison of amplification or deletion event between subtypes. (b) Specific amplification or deletion sites. (c) Bar plot indicating the total alteration frequency. (d) Detailed genomic gain or loss frequencies of CNV.
Figure 8
Figure 8
Drug sensitivity comparison of the two subtypes. (a) Distribution of IC50 values of chemotherapy agents. (b) Novel identified molecular agents for MPCS2 from the GDSC database.
Figure 9
Figure 9
Verification of the remodeling system via external cohorts. (a) Heatmap illustrating the expression pattern of melatonin regulators in ccRCC cell lines. (b) Drug susceptibility assessments were performed using standardized AUC. (c) Heatmap of biomarker expression pattern. (d) Survival analysis of the two predicted subtypes in JAPAN-KIRC.
Figure 10
Figure 10
Construction and verification of a novel risk model. (a) Volcano plot illustrating the prognostic impact of biomarkers. (b) Random forest ranking the importance of the top 10 signatures. (c) The number of signatures' combination and each model's p value. (d, e) Risk score distribution plot divided patients from TCGA-ccRCC and JAPAN-KIRC cohorts into high- and low-risk groups. (f) Survival analysis of the two risk groups in TCGA-ccRCC and JAPAN-KIRC cohorts. (g, h) The time-dependent ROC curves for the two risk groups in TCGA-ccRCC and JAPAN-KIRC cohorts.
Figure 11
Figure 11
Impact of ACHE in ccRCC and pan-cancer. (a) Radom forest tree showing the importance of melatonin-related signatures. (b) Different expression levels of ACHE in ccRCC. (c) Correlation of the ACHE expression level and clinical characteristics in TCGA-KIRC. (d) Impact of ACHE on survival in ccRCC. (e) Verification of ACHE expression in the Changhai cohort. (f, g) Cox analysis and biological analysis of ACHE across cancers. (h) Impact of mutation state of ACHE on ccRCC immunity.

References

    1. Sung H., Ferlay J., Siegel R. L., et al. Global cancer statistics 2020: GLOBOCAN estimates of incidence and mortality worldwide for 36 cancers in 185 countries. CA: a Cancer Journal for Clinicians . 2021;71(3):209–249. doi: 10.3322/caac.21660. - DOI - PubMed
    1. Suna M., Abdollah F., Lughezzani G., et al. Age-adjusted incidence, mortality, and survival rates of stage-specific renal cell carcinoma in North America: a trend analysis. European Urology . 2011;59(1):135–141. doi: 10.1016/j.eururo.2010.10.029. - DOI - PubMed
    1. Ljungberg B., Albiges L., Abu-Ghanem Y., et al. European Association of Urology guidelines on renal cell carcinoma: the 2022 update. European Urology . 2022;82(4):399–410. doi: 10.1016/j.eururo.2022.03.006. - DOI - PubMed
    1. Ljungberg B., Campbell S. C., Cho H. Y., et al. The epidemiology of renal cell carcinoma. European Urology . 2011;60(4):615–621. doi: 10.1016/j.eururo.2011.06.049. - DOI - PubMed
    1. Jian Y., Yang K., Sun X., et al. Current advance of immune evasion mechanisms and emerging immunotherapies in renal cell carcinoma. Frontiers in Immunology . 2021;12:p. 502. doi: 10.3389/fimmu.2021.639636. - DOI - PMC - PubMed