

Characterising paediatric mortality during and after acute illness in Sub-Saharan Africa and South Asia: a secondary analysis of the CHAIN cohort using a machine learning approach
- PMID: 36825237
- PMCID: PMC9941052
- DOI: 10.1016/j.eclinm.2023.101838
Characterising paediatric mortality during and after acute illness in Sub-Saharan Africa and South Asia: a secondary analysis of the CHAIN cohort using a machine learning approach
Abstract
Background: A better understanding of which children are likely to die during acute illness will help clinicians and policy makers target resources at the most vulnerable children. We used machine learning to characterise mortality in the 30-days following admission and the 180-days after discharge from nine hospitals in low and middle-income countries (LMIC).
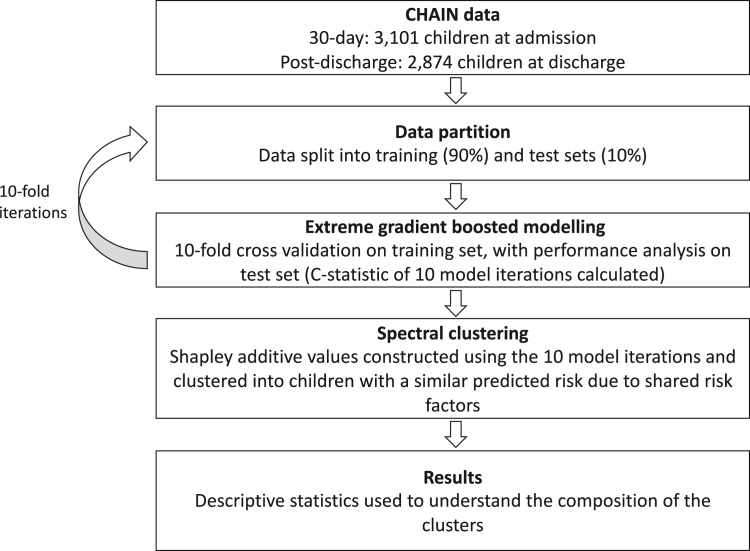
Methods: A cohort of 3101 children aged 2-24 months were recruited at admission to hospital for any acute illness in Bangladesh (Dhaka and Matlab Hospitals), Pakistan (Civil Hospital Karachi), Kenya (Kilifi, Mbagathi, and Migori Hospitals), Uganda (Mulago Hospital), Malawi (Queen Elizabeth Central Hospital), and Burkina Faso (Banfora Hospital) from November 2016 to January 2019. To record mortality, children were observed during their hospitalisation and for 180 days post-discharge. Extreme gradient boosted models of death within 30 days of admission and mortality in the 180 days following discharge were built. Clusters of mortality sharing similar characteristics were identified from the models using Shapley additive values with spectral clustering.
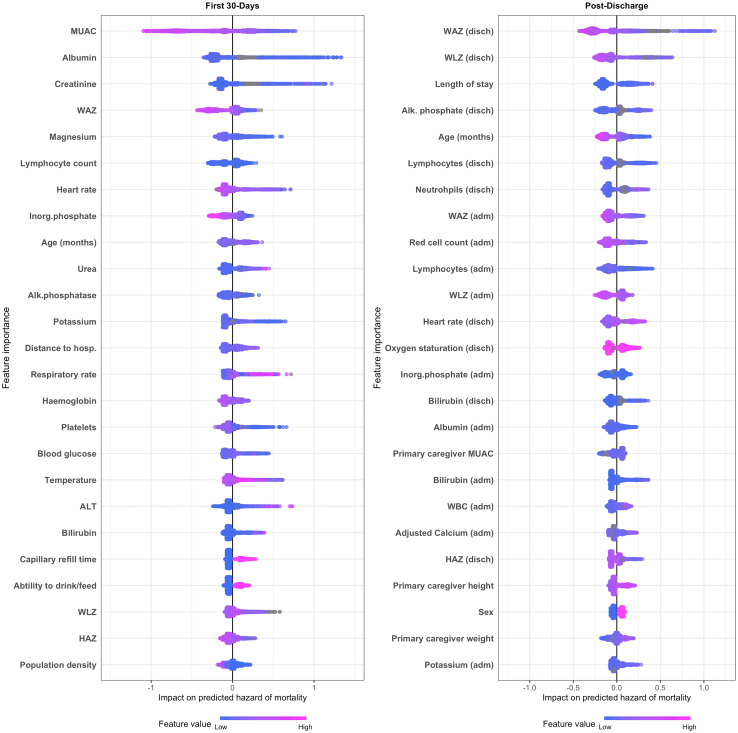
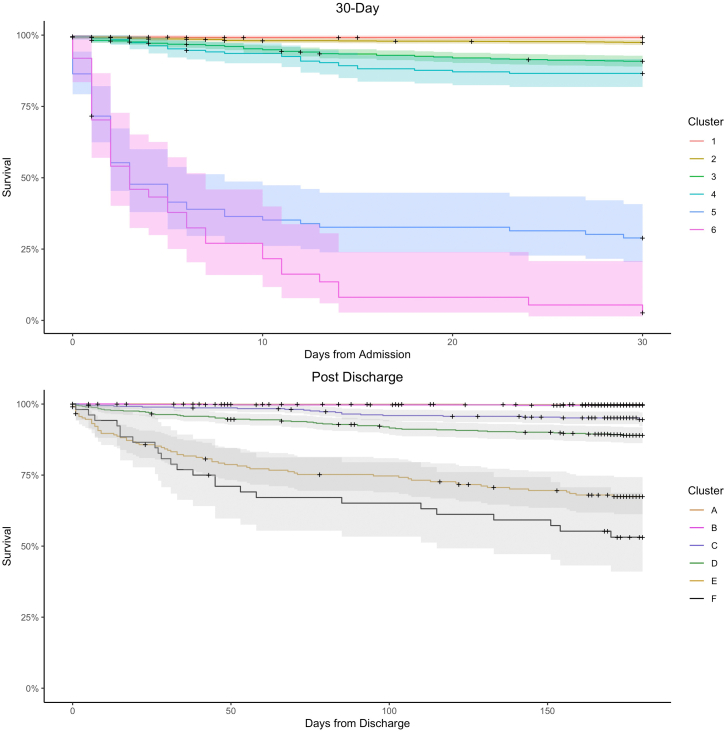
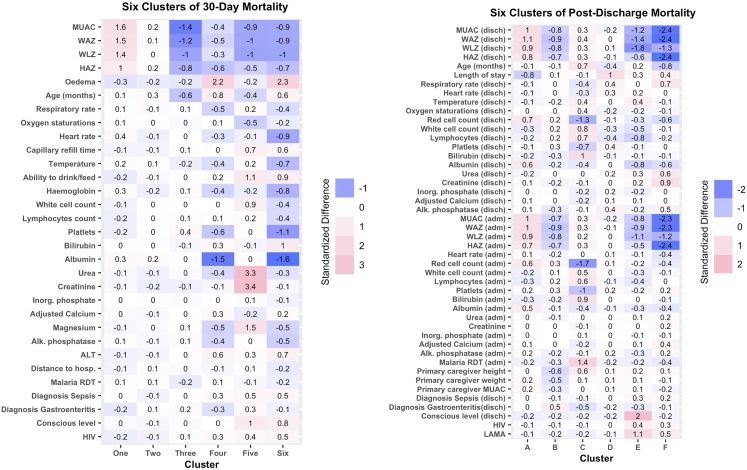
Findings: Anthropometric and laboratory parameters were the most influential predictors of both 30-day and post-discharge mortality. No WHO/IMCI syndromes were among the 25 most influential mortality predictors of mortality. For 30-day mortality, two lower-risk clusters (N = 1915, 61%) included children with higher-than-average anthropometry (1% died, 95% CI: 0-2), and children without signs of severe illness (3% died, 95% CI: 2-4%). The two highest risk 30-day mortality clusters (N = 118, 4%) were characterised by high urea and creatinine (70% died, 95% CI: 62-82%); and nutritional oedema with low platelets and reduced consciousness (97% died, 95% CI: 92-100%). For post-discharge mortality risk, two low-risk clusters (N = 1753, 61%) were defined by higher-than-average anthropometry (0% died, 95% CI: 0-1%), and gastroenteritis with lower-than-average anthropometry and without major laboratory abnormalities (0% died, 95% CI: 0-1%). Two highest risk post-discharge clusters (N = 267, 9%) included children leaving against medical advice (30% died, 95% CI: 25-37%), and severely-low anthropometry with signs of illness at discharge (46% died, 95% CI: 34-62%).
Interpretation: WHO clinical syndromes are not sufficient at predicting risk. Integrating basic laboratory features such as urea, creatinine, red blood cell, lymphocyte and platelet counts into guidelines may strengthen efforts to identify high-risk children during paediatric hospitalisations.
Funding: Bill & Melinda Gates FoundationOPP1131320.
Keywords: Explainable machine learning; Malnutrition; Paediatric mortality; Post-discharge mortality; Wasting.
© 2023 The Author(s).
Conflict of interest statement
All authors declare no competing interests.
Figures
References
-
- UNICEF . 2017. Levels and trends in child mortality: report 2017, estimates developed by the UN inter-agency group for child mortality estimation.
-
- Hossain M., Chisti M.J., Hossain M.I., Mahfuz M., Islam M.M., Ahmed T. Efficacy of World Health Organization guideline in facility-based reduction of mortality in severely malnourished children from low and middle income countries: a systematic review and meta-analysis. J Paediatr Child Health. 2017;53(5):474–479. 20170104. - PubMed
LinkOut - more resources
Full Text Sources
