. 2023 May;17(5):722-736.
doi: 10.1002/1878-0261.13394. Epub 2023 Mar 5.

Cell-free chromatin immunoprecipitation can determine tumor gene expression in lung cancer patients

Affiliations

Cell-free chromatin immunoprecipitation can determine tumor gene expression in lung cancer patients

Christoffer Trier Maansson et al. Mol Oncol. 2023 May.

Abstract

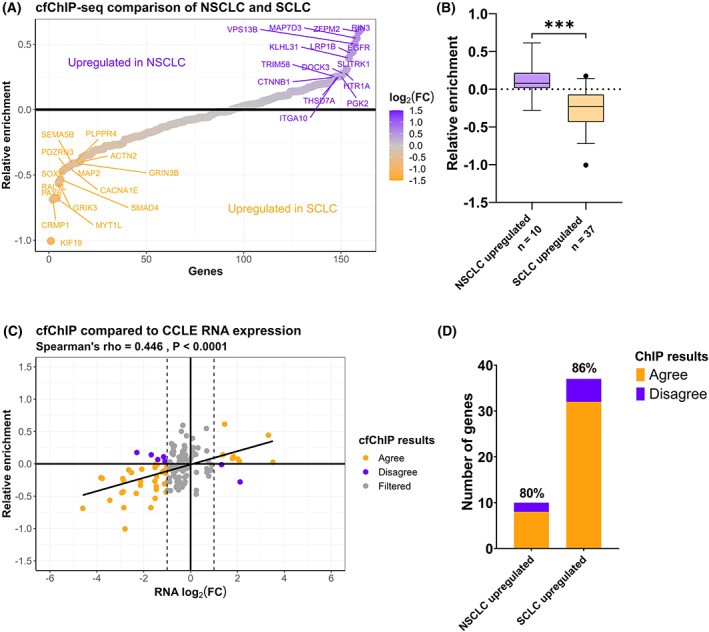
Cell-free DNA (cfDNA) in blood plasma can be bound to nucleosomes that contain post-translational modifications representing the epigenetic profile of the cell of origin. This includes histone H3 lysine 36 trimethylation (H3K36me3), a marker of active transcription. We hypothesised that cell-free chromatin immunoprecipitation (cfChIP) of H3K36me3-modified nucleosomes present in blood plasma can delineate tumour gene expression levels. H3K36me3 cfChIP followed by targeted NGS (cfChIP-seq) was performed on blood plasma samples from non-small-cell lung cancer (NSCLC) patients (NSCLC, n = 8), small-cell lung cancer (SCLC) patients (SCLC, n = 4) and healthy controls (n = 4). H3K36me3 cfChIP-seq demonstrated increased enrichment of mutated alleles compared with normal alleles in plasma from patients with known somatic cancer mutations. Additionally, genes identified to be differentially expressed in SCLC and NSCLC tumours had concordant H3K36me3 cfChIP enrichment profiles in NSCLC (sensitivity = 0.80) and SCLC blood plasma (sensitivity = 0.86). Findings here expand the utility of cfDNA in liquid biopsies to characterise treatment resistance, cancer subtyping and disease progression.

Keywords: cell-free ChIP; epigenetics; gene expression; liquid biopsy; non-small-cell lung cancer; small-cell lung cancer.


Conflict of interest statement

The authors declare no conflict of interest.

Figures

Fig. 1
Fig. 1
Comparison between chromatin immunoprecipitation sequencing (ChIP‐seq) and RNA‐seq in cell lines. (A) Experimental set‐up. Left: RNA was purified from cell cultures and subjected to paired‐end sequencing. Right: H3K36me3 ChIP was performed on the same cell culture as RNA‐seq. Following H3K36me3 ChIP enrichment the isolated DNA was subjected to Cancer personalised profiling by deep sequencing (CAPP‐seq). Created with www.biorender.com. (B) Correlation between mRNA expression levels and H3K36me3 ChIP enrichment in A549, HCC827, and HCC827‐MET cells. P‐values are calculated using the algorithm AS 89. (C) Uniform Manifold Approximation and Projection (UMAP) of triplicate RNA‐seq experiments of A549, HCC827, and HCC827‐MET cell lines. The UMAP is based on transcripts per million (TPM) values of 53 585 transcripts. (D) UMAP of triplicate ChIP‐seq for A549, HCC827, and HCC827‐MET. The UMAP is based on enrichment values of 197 genes in the AVENIO gene panel. (E) Receiver operating characteristic (ROC) analysis of the ability for H3K36me3 ChIP to determine if a gene is active or inactive where the area under the curve (AUC) is indicated for each cell line. The two‐tailed P‐values are calculated using a z‐test where the z‐ratio is calculated as (AUC‐0.50)/SE.
Fig. 2
Fig. 2
Chromatin immunoprecipitation sequencing (ChIP‐seq) can detect different gene expression levels between cell lines. (A) Volcano plots representing RNA‐seq of HCC827 compared to A549 and HCC827 compared to HCC827‐MET (n = 3). False discovery rate (FDR) adjusted log10(q‐values) are plotted relative to the average log2(FC). Genes with an absolute log2(FC) > 1 and q‐value < 0.05 are labeled. (B) log2 average ChIP‐seq enrichment of HCC827‐MET and A549 compared to HCC827 separately (n = 3). Labels indicate differentially expressed genes based on RNA‐seq upregulated in HCC827 (purple), A549 (yellow, left) or HCC827‐MET (yellow, right). (C) Analysis of the agreement between H3K36me3 ChIP‐seq enrichment and RNA‐seq results. H3K36me3 ChIP‐seq is designated to agree with RNA‐seq if a gene displays RNA log2(FC) > 1, q‐value < 0.05 and H3K36me3 ChIP enrichment.
Fig. 3
Fig. 3
Mutated genes display different cell‐free chromatin immunoprecipitation (cfChIP) enrichment. (A) Relative enrichment of cfChIP in NAC.1 compared to NAC.3. Top 15 most differently enriched genes are displayed for each patient. (B) Relative enrichment of cfChIP in NAC.3 compared to NAC.4. Top 15 most differently enriched genes are displayed for each patient. (C) Average relative enrichment of epidermal growth factor receptor (EGFR) mutated non‐small cell lung cancer (NSCLC) patients (n = 2) compared to EGFR WT NSCLC patients (n = 6). Top 15 most differently enriched genes are displayed for each group. (D) The mutational allele fraction (MAF) of all mutations identified in both cfChIP and input samples. The MAF is plotted in paired input and cfChIP samples respectively.
Fig. 4
Fig. 4
Cell‐free chromatin immunoprecipitation sequencing (cfChIP‐seq) of non‐small cell lung cancer (NSCLC) and small cell lung cancer (SCLC) samples. (A) Average relative H3K36me3 cfChIP‐seq enrichment in NSCLC (n = 8) compared to SCLC (n = 4) patient blood samples. The top 15 most enriched genes in each group are labeled. (B) The relative enrichment of differentially expressed genes in NSCLC (n = 10) and SCLC (n = 37) cell lines. *** unpaired t‐test, P < 0.0001. The error bars indicate 5–95 percentile. (C) Correlation between the relative enrichment in NSCLC/SCLC cfChIP samples and the log2(FC) RNA levels between NSCLC and SCLC cell lines. (D) Analysis of agreement between H3K36me3 cfChIP and Cancer Cell Line Encyclopedia (CCLE) mRNA expression data. H3K36me3 cfChIP‐seq is designated to agree with CCLE if a gene displays RNA log2(FC) > 1, q‐value < 0.05 and H3K36me3 ChIP enrichment.

Similar articles

Cited by

References

    1. Oxnard GR, Paweletz CP, Kuang Y, Mach SL, O'Connell A, Messineo MM, et al. Noninvasive detection of response and resistance in EGFR‐mutant lung cancer using quantitative next‐generation genotyping of cell‐free plasma DNA. Clin Cancer Res. 2014;20(6):1698–705. - PMC - PubMed
    1. Diehl F, Schmidt K, Choti MA, Romans K, Goodman S, Li M, et al. Circulating mutant DNA to assess tumour dynamics. Nat Med. 2008;14(9):985–90. - PMC - PubMed
    1. Sorensen BS, Wu L, Wei W, Tsai J, Weber B, Nexo E, et al. Monitoring of epidermal growth factor receptor tyrosine kinase inhibitor‐sensitizing and resistance mutations in the plasma DNA of patients with advanced non‐small cell lung cancer during treatment with erlotinib. Cancer. 2014;120(24):3896–901. - PMC - PubMed
    1. Guibert N, Pradines A, Farella M, Casanova A, Gouin S, Keller L, et al. Monitoring KRAS mutations in circulating DNA and tumour cells using digital droplet PCR during treatment of KRAS‐mutated lung adenocarcinoma. Lung Cancer. 2016;100:1–4. - PubMed
    1. Guibert N, Mazieres J, Delaunay M, Casanova A, Farella M, Keller L, et al. Monitoring of KRAS‐mutated ctDNA to discriminate pseudo‐progression from true progression during anti‐PD‐1 treatment of lung adenocarcinoma. Oncotarget. 2017;8(23):38056–60. - PMC - PubMed

Publication types