. 2023 Mar;62(3):44.
doi: 10.3892/ijo.2023.5492. Epub 2023 Feb 24.

Dual targets of lethal apoptosis and protective autophagy in liver cancer with periplocymarin elicit a limited therapeutic effect

Affiliations

Dual targets of lethal apoptosis and protective autophagy in liver cancer with periplocymarin elicit a limited therapeutic effect

Yuanyuan Hao et al. Int J Oncol. 2023 Mar.

Abstract

Cardiac glycosides (CGs) are candidate anticancer agents that function by increasing [Ca2+]i to induce apoptotic cell death in several types of cancer cells. However, new findings have shown that the anti‑cancer effects of CGs involve complex cell‑signal transduction mechanisms. Hence, exploring the potential mechanisms of action of CGs may provide insight into their anti‑cancer effects and thus aid in the selection of the appropriate CG. Periplocymarin (PPM), which is a cardiac glycoside, is an active ingredient extracted from Cortex periplocae. The role of PPM was evaluated in HepG2 cells and xenografted nude mice. Cell proliferation, real‑time ATP rate assays, western blotting, cell apoptosis assays, short interfering RNA transfection, the patch clamp technique, electron microscopy, JC‑1 staining, immunofluorescence staining and autophagic flux assays were performed to evaluate the function and regulatory mechanisms of PPM in vitro. The in vivo activity of the PPM was assessed using a mouse xenograft model. The present study demonstrated that PPM synchronously activated lethal apoptosis and protective autophagy in liver cancer, and the initiation of autophagy counteracted the inherent pro‑apoptotic capacity and impaired the anti‑cancer effects. Specifically, PPM exerted a pro‑-apoptotic effect in HepG2 cells and activated macroautophagy by initiation of the AMPK/ULK1 and mTOR signaling pathways. Activation of macroautophagy counteracted the pro‑apoptotic effects of PPM, but when it was combined with an autophagy inhibitor, the anti‑cancer effects of PPM in mice bearing HepG2 xenografts were observed. Collectively, these results indicated that a self‑limiting effect impaired the pro‑apoptotic effects of PPM in liver cancer, but when combined with an autophagy inhibitor, it may serve as a novel therapeutic option for the management of liver cancer.

Keywords: apoptosis; autophagy; cardiac glycosides; liver cancer; periplocymarin.


Conflict of interest statement

The authors declare that they have no competing interests.

Figures

Figure 1
Figure 1
PPM inhibits the growth of liver cancer cells. (A) The chemical structure of PPM. (B) HepG2 and Huh7 cells were treated with different concentrations (1-10,000 nmol/l) of PPM for 48 h, and cell viability was measured using MTS assays. (C) Transwell invasion assays were used to assess HepG2 cell invasion ability. Scale bar=50 µm. (D) A scratch wound assay for HepG2 cells transfected with or without PPM. Scale bar=1,000 µm. (E) Colony formation assays for HepG2 cells transfected with or without PPM. Data are presented as mean ± SD, n=3. PPM, periplocymarin.
Figure 2
Figure 2
Establishing the 3D model from HepG2 cell lines. (A) Representative micrographs of HepG2 cells cultured in monolayer and spheroid. Scale bar=50 µm. (B) MTS assay was used to assess whether HepG2-3D cells treated with PPM were viable at 48 h. IC50=0.7419 µmol/l. (C) The sphere-formation of HepG2 cells induced by PPM (10−5, 10−6, 10−7, 10−8 and 10−9 mol/l) was tracked by microscopy. PPM, periplocymarin.
Figure 3
Figure 3
PPM activates the mitochondrial intrinsic apoptotic pathway. (A) Representative fluorescence microscopy images of JC-1 staining; red fluorescence represents the mitochondrial aggregate JC-1 and green fluorescence indicates the monomer JC-1. Scale bar=20 µm. (B) Resting membrane potential. (C) Relative cell viability of HepG2 cells treated with PPM and/or 25 mmol/l KCl for 24 h. (D) ATP production rates due to glycolysis or mitochondrial respiration as measured with the XF Real-Time ATP rate assay using XFe24 Agilent Seahorse. (E) The protein expression levels of caspase 7, caspase 9, caspase 3, cleaved caspase 3, Bcl-2 and Bax in HepG2 cells treated with PPM were assessed using western blotting. (F) HepG2 cells were treated with PPM (100 nmol/l) and/or 20 µmol/l Z-VAD-FMK for 24 h. Caspase 3 and Cleaved caspase 3 protein expression levels were assessed using western blotting. GAPDH was used as the loading control. Data are presented as mean ± SD, n=3; *P<0.05 and ***P<0.001 vs. control. &P<0.05 vs. KCl. #P<0.05 vs. Z-VAD-FMK. n.s., not significant. PPM, periplocymarin; glycolATP, glycolytic ATP; mitoATP, mitochondrial ATP.
Figure 4
Figure 4
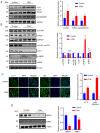
PPM selectively activated macroautophagy in HepG2 cells. (A) Western blotting of LC3, ATG4A and p62/SQSTM1 and (B) p-mTOR, mTOR, p-ULK1(Ser757), ULK1, p-AMPKα (Thr172) and AMPKα protein expression levels after treatment with PPM (100 nmol/l) in HepG2 cells. (C) Immunofluorescence staining of LC3 and p62/SQSTM1. Scale bar=20 µm. (D) Western blotting of the mitophagy markers BNIP3 and PINK1. GAPDH or β-actin was used as a loading control. Data are presented as mean ± SD, n=3; *P<0.05, **P<0.01 and ***P<0.001 vs. control. n.s., not significant; PPM, periplocymarin; p, phosphorylated; LC3, microtubule-associated protein light chain 3; ATG4A, ATG4A; p62/SQSTM1, sequestosome 1; ULK1, Unc-51-like kinase 1; BNIP3, BCL2 Interacting Protein 3; PINK1, PTEN induced putative kinase 1.
Figure 5
Figure 5
PPM-induced macroautophagy counteracted the apoptosis cell death. (A) LC3 protein expression levels of HepG2 cells with ATP1A1 knockdown and/or treated with PPM (100 nmol/l). HepG2 cells were treated with PPM (100 nmol/l) and/or 3-MA (5 mmol/l) for 24 h; (B) cell viability was then determined using MTS assays and (C) apoptosis was analyzed using flow cytometry. GAPDH or β-actin was used as a loading control. Data are presented as mean ± SD, n=3; **P<0.01 and ***P<0.001 vs. control. ###P<0.001 vs. PPM. n.s., not significant; PPM, periplocymarin; siRNA, short interfering; LC3, microtubule-associated protein light chain 3; ATP1A1, ATPase Na+/K+ transporting subunit α1.
Figure 6
Figure 6
The pro-apoptosis effect of PPM might impair the function of autophagic lysosomes. (A) LC3 were assessed using western blotting. (B) Electron microscopy showed that PPM treatment led to autolysosome increase. Black arrows indicate the autolysosomes. (C) HepG2 cells were treated with PPM (100 nmol/l) and/or Baf A1 (50 nmol/l) for 24 h. LC3-II and p62/SQSTM1 protein expression levels were assessed using western blotting. (D) HepG2 cells were transfected with RFP-GFP-LC3 lentivirus and treated with PPM (100 nmol/l) for 24 h. Cells were observed to distinguish between autophagosome (yellow puncta) after colocalization analysis using a confocal microscope. Scale bar=10 µm. (E) HepG2 cells were treated with PPM (100 nmol/l) for 24 h and the protein expression levels of LAMP1, CTSB and CTSD were assessed using western blotting. (F) HepG2 cells were treated with PPM (100 nM) and/or 20 µmol/l Z-VAD-FMK for 24 h. LC3 and p62/SQSTM1 levels were detected by using western blot analysis. GAPDH or β-actin were used as a loading control. Data are presented as mean ± SD, n=3; *P<0.05, **P<0.01 and ***P<0.001 vs. control. &&&P<0.001 vs. 3-MA. $P<0.05 vs. Baf A1. ##P<0.01 vs. PPM. n.s., not significant; ASS, autophagolysosome; M, mitochondria; PPM, periplocymarin; LC3, microtubule-associated protein light chain 3; SQSTM1/p62, sequestosome 1/p62; LAMP1, Lysosomal-associated membrane protein 1; CTSB, cathepsin B; CTSD, cathepsin D; RFP-GFP-LC3, red fluorescence point-green fluorescence point-LC3.
Figure 7
Figure 7
PPM exerted anti-tumor activity in the HepG2 xenograft tumor model. HepG2 xenograft tumors grew in nude mice after control (vehicle), PPM (100 mg/kg) and 3-MA (2 mg/kg) + PPM treatments administered orally daily for 7 days, n=4. (A) Average final tumor weight and (B) body weight of mice. (C) The growth of HepG2 xenograft tumors in nude mice. (D) Representative images of the tumor samples from each group. (E) Immunofluorescence staining for Ki67 and Tunnel in tumor sections. Scale bar=20 µm. Data are presented as mean ± SD. *P<0.05, **P<0.01 and ***P<0.001 vs. control; &P<0.05 and &&&P<0.001 vs. PPM. n.s., not significant; PPM, periplocymarin; 3-MA, 3-methyladenine.

References

    1. Bray F, Ferlay J, Soerjomataram I, Siegel RL, Torre LA, Jemal A. Global cancer statistics 2018: GLOBOCAN estimates of incidence and mortality worldwide for 36 cancers in 185 countries. CA Cancer J Clin. 2018;68:394–424. doi: 10.3322/caac.21492. - DOI - PubMed
    1. Massarweh NN, El-Serag HB. Epidemiology of hepatocellular carcinoma and intrahepatic cholangiocarcinoma. Cancer Control. 2017;24:1073274817729245. doi: 10.1177/1073274817729245. - DOI - PMC - PubMed
    1. Bruix J, Gores GJ, Mazzaferro V. Hepatocellular carcinoma: Clinical frontiers and perspectives. Gut. 2014;63:844–855. doi: 10.1136/gutjnl-2013-306627. - DOI - PMC - PubMed
    1. Guo H, Wu T, Lu Q, Li M, Guo JY, Shen Y, Wu Z, Nan KJ, Lv Y, Zhang XF. Surgical resection improves long-term survival of patients with hepatocellular carcinoma across different Barcelona clinic liver cancer stages. Cancer Manag Res. 2018;10:361–369. doi: 10.2147/CMAR.S152707. - DOI - PMC - PubMed
    1. Cheng L, Wang C, Ma X, Wang Q, Cheng Y, Wang H, Li Y, Liu Z. Multifunctional upconversion nanoparticles for dual-modal imaging-guided stem cell therapy under remote magnetic control. Advanced Functional Materials. 2013;21:272–280. doi: 10.1002/adfm.201201733. - DOI