Review
. 2023 Apr 1;134(4):900-914.
doi: 10.1152/japplphysiol.00768.2022. Epub 2023 Feb 24.

Human skeletal muscle-specific atrophy with aging: a comprehensive review

Affiliations
Review

Human skeletal muscle-specific atrophy with aging: a comprehensive review

Masatoshi Naruse et al. J Appl Physiol (1985). .

Abstract

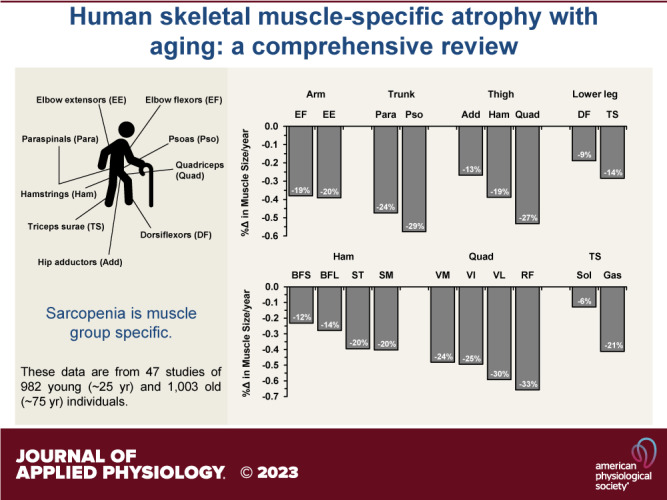
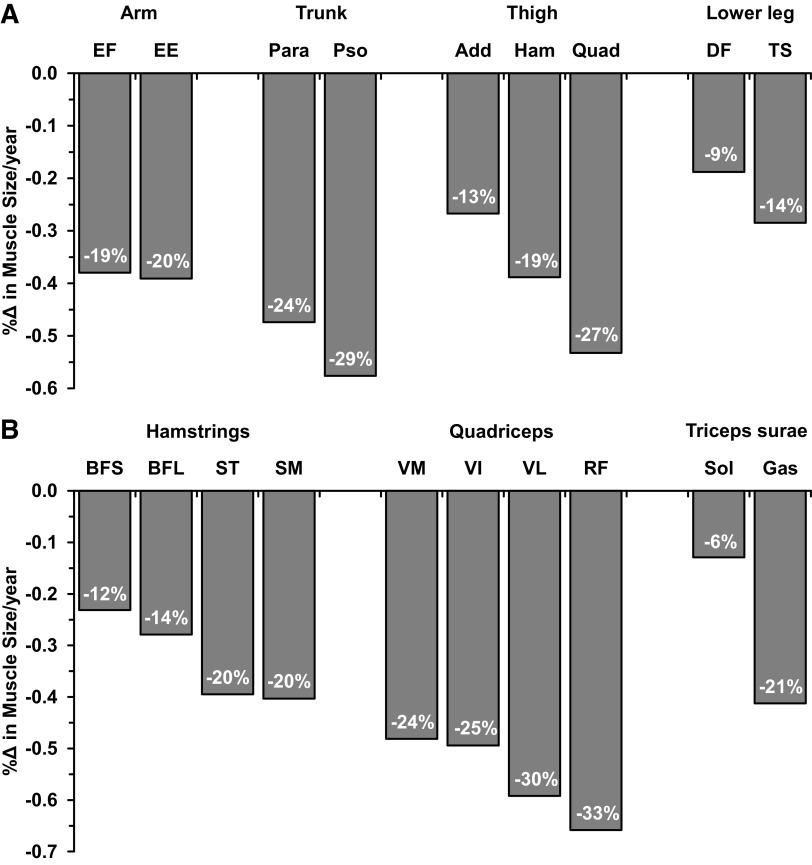
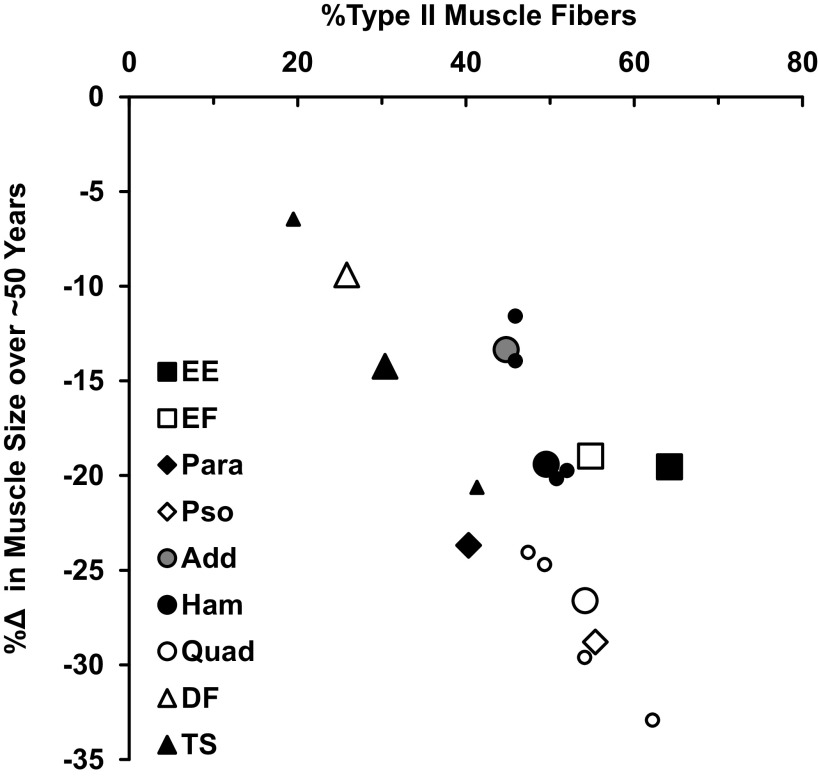
Age-related skeletal muscle atrophy appears to be a muscle group-specific process, yet only a few specific muscles have been investigated and our understanding in this area is limited. This review provides a comprehensive summary of the available information on age-related skeletal muscle atrophy in a muscle-specific manner, nearly half of which comes from the quadriceps. Decline in muscle-specific size over ∼50 yr of aging was determined from 47 cross-sectional studies of 982 young (∼25 yr) and 1,003 old (∼75 yr) individuals and nine muscle groups: elbow extensors (-20%, -0.39%/yr), elbow flexors (-19%, -0.38%/yr), paraspinals (-24%, -0.47%/yr), psoas (-29%, -0.58%/yr), hip adductors (-13%, -0.27%/yr), hamstrings (-19%, -0.39%/yr), quadriceps (-27%, -0.53%/yr), dorsiflexors (-9%, -0.19%/yr), and triceps surae (-14%, -0.28%/yr). Muscle-specific atrophy rate was also determined for each of the subcomponent muscles in the hamstrings, quadriceps, and triceps surae. Of all the muscles included in this review, there was more than a fivefold difference between the least (-6%, -0.13%/yr, soleus) to the most (-33%, -0.66%/yr, rectus femoris) atrophying muscles. Muscle activity level, muscle fiber type, sex, and timeline of the aging process all appeared to have some influence on muscle-specific atrophy. Given the large range of muscle-specific atrophy and the large number of muscles that have not been investigated, more muscle-specific information could expand our understanding of functional deficits that develop with aging and help guide muscle-specific interventions to improve the quality of life of aging women and men.

Keywords: aging; sarcopenia; skeletal muscle mass.


Conflict of interest statement

No conflicts of interest, financial or otherwise, are declared by the authors.

Figures

None
Graphical abstract
Figure 1.
Figure 1.
Summary of skeletal muscle-specific atrophy with aging from cross-sectional studies. Muscle atrophy rates (%Δ/yr) are from Tables 1, 2 and 3. Percentage in each bar is the yearly rate multiplied by 50 to equally represent the muscle atrophy over 50 yr of aging from ∼25 yr to ∼75 yr across muscle groups. A: nine muscle groups included in this review. B: subcomponent muscles. Add, hip adductors; BFL, biceps femoris long head; BFS, biceps femoris short head; DF, dorsiflexors; EE, elbow extensors; EF, elbow flexors; Gas, gastrocnemius; Ham, hamstrings; Para, paraspinals; Pso, psoas; Quad, quadriceps; RF, rectus femoris; SM, semimembranosus; Sol, soleus; ST, semitendinosus; TS, triceps surae; VI, vastus intermedius; VL, vastus lateralis; VM, vastus medialis.
Figure 2.
Figure 2.
Relationship between the percentage of type II muscle fibers and muscle atrophy over ∼50 yr of aging (r = −0.73). Muscle fiber types (%type II) are mean data from Table 4. Muscle atrophy rates (%Δ) are from Fig. 1. For hamstrings, quadriceps, and triceps surae, data for subcomponent muscles are also included as similar, but smaller symbols of the main muscle group. Add, hip adductors; DF, dorsiflexors; EE, elbow extensors; EF, elbow flexors; Ham, hamstrings; Para, paraspinals; Pso, psoas; Quad, quadriceps; TS, triceps surae.

References

    1. Larsson L, Degens H, Li M, Salviati L, Lee YI, Thompson W, Kirkland JL, Sandri M. Sarcopenia: aging-related loss of muscle mass and function. Physiol Rev 99: 427–511, 2019. doi:10.1152/physrev.00061.2017. - DOI - PMC - PubMed
    1. Chambers TL, Burnett TR, Raue U, Lee GA, Finch WH, Graham BM, Trappe TA, Trappe S. Skeletal muscle size, function, and adiposity with lifelong aerobic exercise. J Appl Physiol (1985) 128: 368–378, 2020. doi:10.1152/japplphysiol.00426.2019. - DOI - PMC - PubMed
    1. Frontera WR, Hughes VA, Fielding RA, Fiatarone MA, Evans WJ, Roubenoff R. Aging of skeletal muscle: a 12-yr longitudinal study. J Appl Physiol (1985) 88: 1321–1326, 2000. doi:10.1152/jappl.2000.88.4.1321. - DOI - PubMed
    1. Janssen I, Heymsfield SB, Wang ZM, Ross R. Skeletal muscle mass and distribution in 468 men and women aged 18-88 yr. J Appl Physiol (1985) 89: 81–88, 2000. [Erratum in J Appl Physiol (1985) 116: 1342, 2014]. doi:10.1152/jappl.2000.89.1.81. - DOI - PubMed
    1. Kyle UG, Genton L, Hans D, Karsegard L, Slosman DO, Pichard C. Age-related differences in fat-free mass, skeletal muscle, body cell mass and fat mass between 18 and 94 years. Eur J Clin Nutr 55: 663–672, 2001. doi:10.1038/sj.ejcn.1601198. - DOI - PubMed

Publication types

LinkOut - more resources