. 2023 Mar 15;136(6):jcs259875.
doi: 10.1242/jcs.259875. Epub 2023 Mar 21.

The synthetic TRPML1 agonist ML-SA1 rescues Alzheimer-related alterations of the endosomal-autophagic-lysosomal system

Affiliations

The synthetic TRPML1 agonist ML-SA1 rescues Alzheimer-related alterations of the endosomal-autophagic-lysosomal system

Aleksandra Somogyi et al. J Cell Sci. .

Abstract

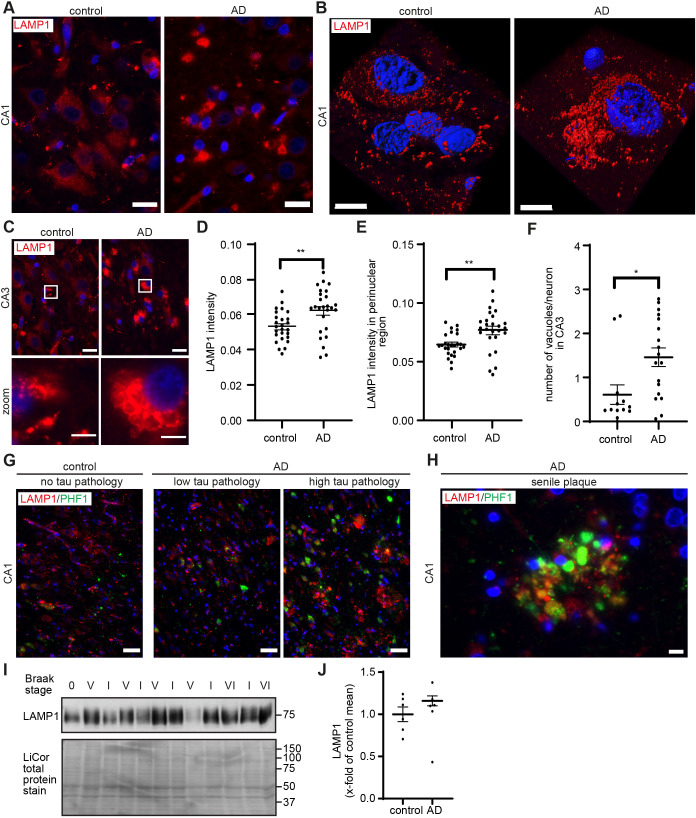
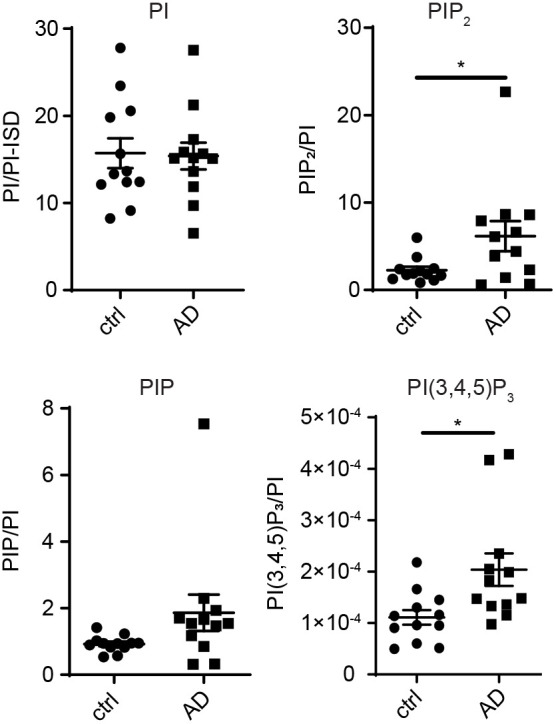
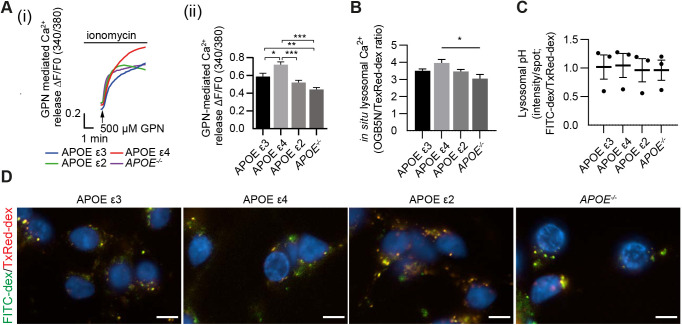
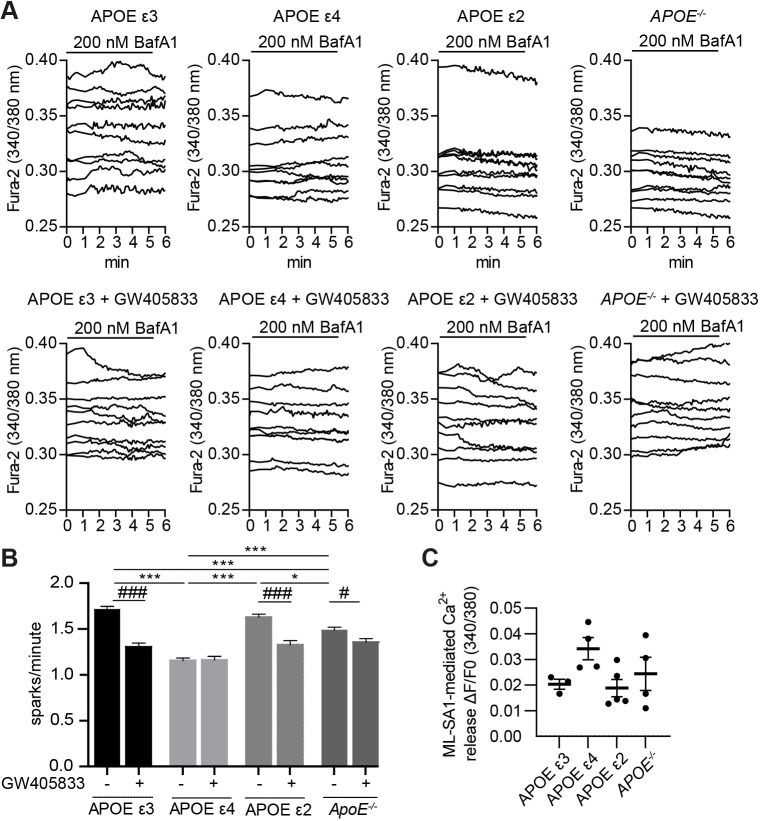
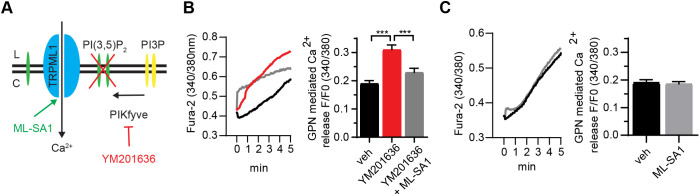
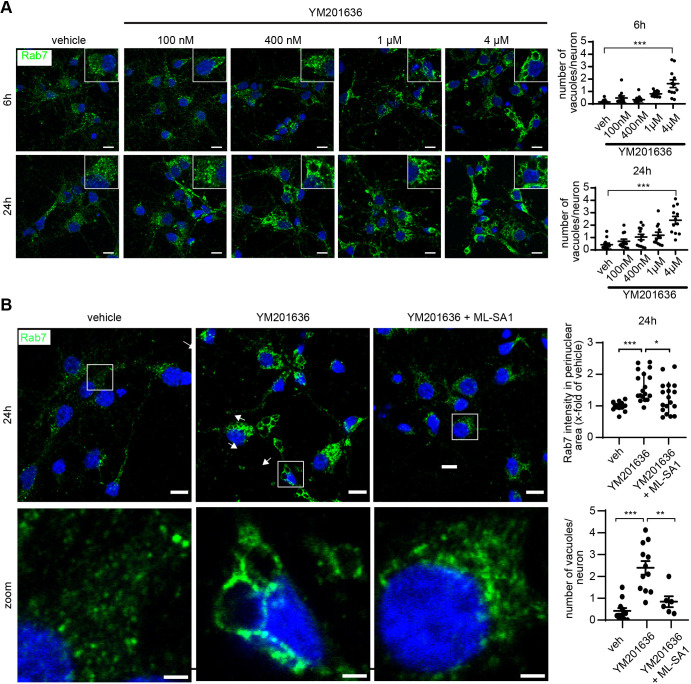
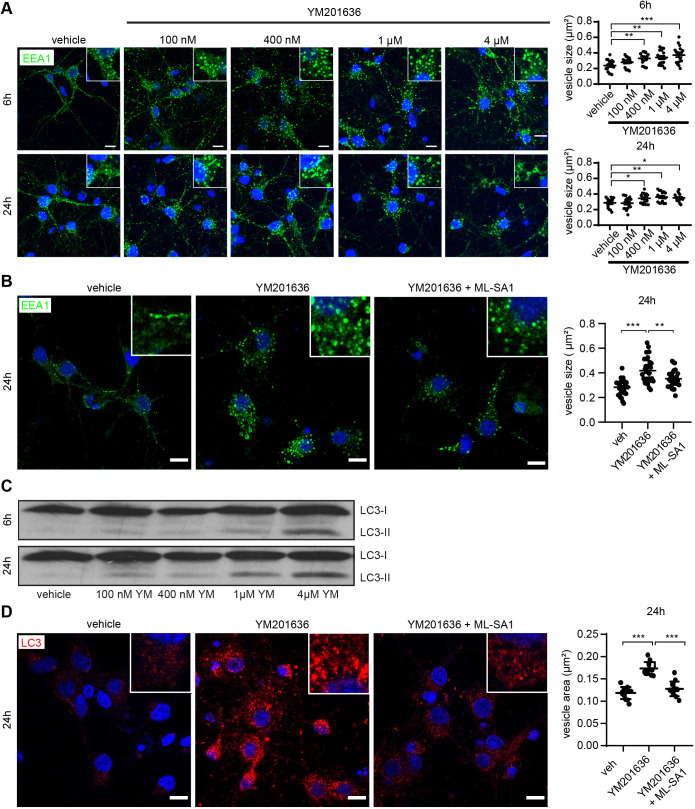
Abnormalities in the endosomal-autophagic-lysosomal (EAL) system are an early event in Alzheimer's disease (AD) pathogenesis. However, the mechanisms underlying these abnormalities are unclear. The transient receptor potential channel mucolipin 1(TRPML1, also known as MCOLN1), a vital endosomal-lysosomal Ca2+ channel whose loss of function leads to neurodegeneration, has not been investigated with respect to EAL pathogenesis in late-onset AD (LOAD). Here, we identify pathological hallmarks of TRPML1 dysregulation in LOAD neurons, including increased perinuclear clustering and vacuolation of endolysosomes. We reveal that induced pluripotent stem cell (iPSC)-derived human cortical neurons expressing APOE ε4, the strongest genetic risk factor for LOAD, have significantly diminished TRPML1-induced endolysosomal Ca2+ release. Furthermore, we found that blocking TRPML1 function in primary neurons by depleting the TRPML1 agonist PI(3,5)P2 via PIKfyve inhibition, recreated multiple features of EAL neuropathology evident in LOAD. This included increased endolysosomal Ca2+ content, enlargement and perinuclear clustering of endolysosomes, autophagic vesicle accumulation and early endosomal enlargement. Strikingly, these AD-like neuronal EAL defects were rescued by TRPML1 reactivation using its synthetic agonist ML-SA1. These findings implicate defects in TRPML1 in LOAD EAL pathogenesis and present TRPML1 as a potential therapeutic target.

Keywords: APOE; Alzheimer's disease; Ca2+; PIKfyve; Phosphoinositides; TRPML1.


Conflict of interest statement

Competing interests The authors declare no competing or financial interests.

Figures

Fig. 1.
Fig. 1.
Increased levels and altered subcellular distribution of LAMP1-positive endolysosomes in the AD brain. (A,C) Representative images showing the accumulation and swelling of LAMP1-positive vesicles in cells of the CA1 (A) and CA3 (C) regions of hippocampal sections of AD (n=10) and control cases (n=10). Scale bars: 20 µm. Detailed sections of single neurons are shown in bottom panel of C. Scale bars: 5 µm. (B) Surface-rendered 3D reconstruction of LAMP1-positive vesicles in a morphologically identified CA1 pyramidal neuron of an AD patient and control. Scale bars: 10 µm. (D,E) Quantification of LAMP1 intensity in the CA1 region (D) and specifically in the perinuclear area (E) from n=6 AD cases and n=8 control cases with 2–5 representative images analysed for each case, together analysing n=26 control images and n=26 AD images. (F) Quantification of the number of enlarged LAMP1 immunoreactive vesicles per neuron in the CA3 region. (G) Representative images showing increased LAMP1 immunoreactivity in cells of the CA1 region accumulating PHF-1 immunoreactive tau in AD patients (n=10, right) and control (n=10, left), and areas of AD CA1 with little PHF1 immunoreactive tau (middle). (H) Representative image of LAMP1 localisation to senile plaques decorated with PHF-1 immunoreactive tau (n=10 AD cases). (I) Western immunoblot analysis of temporal cortex membrane fractions (n=6) showing a trend towards increased LAMP1 levels in AD patients compared with controls (n.s.). LiCor total protein stain was used to ensure equal loading. (J) Quantification of LAMP1 immunoblot data. Data are expressed as mean±s.e.m. *P<0.05; **P<0.01 (unpaired two-tailed Student's t-test).
Fig. 2.
Fig. 2.
Levels of phosphoinositides with the potential to regulate TRPML1 are altered in the temporal cortex of AD patients. HPLC-MS analysis of PI per PI-internal standard (PI/PI-ISD), as described in the Materials and Methods. Levels of total PIP, PIP2 and PI(3,4,5)P3 in mid temporal cortex tissue of AD (n =12) and control (n=12) groups. Levels of total PIP3 [PI(3,4,5)P3] and total PIP2 [PI(4,5)P2, PI(3,4)P2 and PI(3,5)P2], were significantly increased (*P<0.05, unpaired two-tailed Student's t-test) in AD cases compared to controls. Regio-isomer classification showed that increased total PIP2 levels in AD cases represented PI(4,5)P2 (data not shown). Data are expressed as mean±s.e.m.
Fig. 3.
Fig. 3.
Increased lysosomal Ca2+ levels in a neuronal LOAD iPSC model. (A) APOE ε3, APOE ε4, APOE ε2 or APOE−/− iPSC neurons were loaded with Fura2-AM and treated with ionomycin followed by GPN to release lysosomal Ca2+. Representative traces (i) and quantification (ii) of GPN-induced Ca2+ release following ionomycin pre-treatment. (B) Quantification of in situ Ca2+ levels as fluorescence ratio between the Ca2+-sensitive OGB (0.5 mg/ml) and Ca2+-insensitive Texas Red–Dextran (0.1 mg/ml) as loading control in n=5 biological replicates, n=1 technical replicate per APOE isoform. (C,D) Quantification (C) and representative images (D) of APOE ε3, APOE ε4, APOE ε2 or APOE−/− iPSC neurons loaded with pH-sensitive FITC–dextran (0.5 mg/ml) and pH-insensitive Texas Red–dextran (0.25 mg/ml), as loading control, showed no difference in lysosomal pH. Scale bars: 10 µm.
Fig. 4.
Fig. 4.
Decreased TRPML1-mediated lysosomal Ca2+ release in a neuronal LOAD iPSC model. (A,B) APOE ε3, APOE ε4, APOE ε2 or APOE−/− iPSC neurons were loaded with Fura2-AM and treated with the IP3 receptor antagonist xestospongin C to block Ca2+ efflux from the ER, followed by BafA1 to mimic age-related mild deacidification. TRPML1 activity was assessed by counting spontaneous sparks of Ca2+ release during a 5-min period in the presence [APOE ε3 (n=11, 235 traces), APOE ε4 (n=12, 243 traces), APOE ε2 (n=10, 226 traces), APOE−/− (n=11, 257 traces)] or absence [APOE ϵ3 (n=6, 90 traces), APOE ϵ4 (n=6, 101 traces), APOE ϵ2 (n=6, 130 traces), APOE−/− (n=7, 163 traces)] of the TRPML1 inhibitor GW405833 (10 µM). The response of representative cells is depicted and expressed as the 340/380 nm ratio of Fura2-AM florescence. Representative traces (A) and quantification (B) of spark number/minute induced by BafA1. Significance levels were calculated between all samples without GW405833 to detect APOE isoform-specific alterations in TRPML1 response (*P<0.05; **P<0.01; ***P<0.001, one-way ANOVA followed by Bonferroni post-hoc test) and for each APOE isoform between GW405833-treated and untreated sample to assess TRPML1 contribution (#P<0.05; ###P<0.001, unpaired two-tailed Student's t-test). (C) Quantification of full physiological cellular Ca2+ release after addition of 10 µM ML-SA1 including, but not limited to lysosomal Ca2+ stores in n=3 biological replicates, n=1 technical replicate per APOE isoform. Data are expressed as mean±s.e.m.
Fig. 5.
Fig. 5.
ML-SA1 rescues YM201636-mediated Ca2+ accumulation in rat primary cortical neurons. (A) Scheme of TRPML1 inactivation by PIKfyve inhibition and reactivation by ML-SA1. (B) Lysosomal Ca2+ was measured in neurons loaded with Fura2-AM, using 500 µM GPN to release lysosomal Ca2+ following a 2 µM ionomycin pre-treatment to clamp all other intracellular Ca2+ stores, in rat primary cortical neurons pre-treated with 4 µM YM201636 (red, n=6, 72 traces) for 24 h when compared to vehicle (veh, black, n=7, 118 traces) only. Co-treatment with 50 µM ML-SA1 (grey, n=6, 77 traces) restored the lysosomal Ca2+ pool. Representative trace (left) and quantification (right). (C) Rat primary cortical neurons were pre-treated with either 50 µM ML-SA1 (grey, n=3, 388 traces) or vehicle (black, n=3, 381 traces) for 24 h. Lysosomal Ca2+ content was measured as in B, but no change was detected. ***P<0.001 (one-way ANOVA, followed by Bonferroni post-hoc test). Data are expressed as mean±s.e.m.
Fig. 6.
Fig. 6.
Enlargement of Rab7-positive endolysosomes is dose dependent for YM201636 and can be rescued by ML-SA1 co-treatment. (A) Representative images (left) and quantification (right) showing that depletion of PI(3,5)P2 using 100 nM–4 µM YM201636 in rat primary cortical neurons led to a dose-dependent increase in the size and intensity of Rab7-positive late endolysosomes. (B) Representative confocal images (left, top row), zoom (left, bottom row) and quantification (right) showing endolysosomal vacuolation and perinuclear accumulation of Rab7-positive vesicles, in rat primary cortical neurons after PIKfyve inhibition using 4 µM YM201636, which is restored by co-treatment with 50 µM ML-SA1. Quantitative data is based on four separate experiments with three images for each condition from two separate coverslips. veh, vehicle. Scale bars: 10 µm (main images) and 2 µm (magnifications). *P<0.05; **P<0.01; ***P<0.001 (one-way ANOVA, followed by Bonferroni post-hoc test). Data are expressed as mean±s.e.m.
Fig. 7.
Fig. 7.
Enlargement of EEA1-positive endosomes and increase in autophagy are dose dependent for YM201636 and can be rescued by ML-SA1 co-treatment. (A,C) Representative images (left) and quantification (right) showing that depletion of PI(3,5)P2 using 100 nM–4 µM YM201636 (YM) in rat primary cortical neurons led to a dose-dependent increase in the size and intensity of early (EEA1) endosomes as well as to an accumulation of the autophagic marker LC3-II (C). Image in C representative of three repeats. (B,D) Representative confocal images (left) and quantification (right) showing early endosomal enlargement of EEA1-positive vesicles (B) and accumulation of LC3-II-positive autophagic vesicles (D) in rat primary cortical neurons after PIKfyve inhibition by 4 µM YM201636, which is restored by co-treatment with 50 µM ML-SA1. Scale bars: 10 µm. Quantitative data is based on four separate experiments with three images for each condition from two separate coverslips. *P<0.05; **P<0.01; ***P<0.001 (one-way ANOVA followed by Bonferroni post-hoc test). Data are expressed as mean±s.e.m.

References

    1. Akwa, Y., Di Malta, C., Zallo, F., Gondard, E., Lunati, A., Diaz-De-Grenu, L. Z., Zampelli, A., Boiret, A., Santamaria, S., Martinez-Preciado, M.et al. (2023). Stimulation of synaptic activity promotes TFEB-mediated clearance of pathological MAPT/Tau in cellular and mouse models of tauopathies. Autophagy 19, 660-677. 10.1080/15548627.2022.2095791 - DOI - PMC - PubMed
    1. Bae, M., Patel, N., Xu, H., Lee, M., Tominaga-Yamanaka, K., Nath, A., Geiger, J., Gorospe, M., Mattson, M. P. and Haughey, N. J. (2014). Activation of TRPML1 clears intraneuronal Aβ in preclinical models of HIV infection. J. Neurosci. 34, 11485-11503. 10.1523/JNEUROSCI.0210-14.2014 - DOI - PMC - PubMed
    1. Balklava, Z., Niehage, C., Currinn, H., Mellor, L., Guscott, B., Poulin, G., Hoflack, B. and Wassmer, T. (2015). The amyloid precursor protein controls PIKfyve function. PLoS One 10, e0130485. 10.1371/journal.pone.0130485 - DOI - PMC - PubMed
    1. Balla, T. (2013). Phosphoinositides: tiny lipids with giant impact on cell regulation. Physiol. Rev. 93, 1019-1137. 10.1152/physrev.00028.2012 - DOI - PMC - PubMed
    1. Bargal, R., Avidan, N., Olender, T., Ben Asher, E., Zeigler, M., Raas-Rothschild, A., Frumkin, A., Ben-Yoseph, O., Friedlender, Y., Lancet, D.et al. (2001). Mucolipidosis type IV: novel MCOLN1 mutations in Jewish and non-Jewish patients and the frequency of the disease in the Ashkenazi Jewish population. Hum. Mutat. 17, 397-402. 10.1002/humu.1115 - DOI - PubMed

Publication types

Substances