. 2023 Feb 9;45(2):1483-1499.
doi: 10.3390/cimb45020096.

Therapeutic Effects of Aloe saponaria against Ulcerative Colitis Induced by Dextran Sulfate Sodium

Affiliations

Therapeutic Effects of Aloe saponaria against Ulcerative Colitis Induced by Dextran Sulfate Sodium

Do Yeong Kweon et al. Curr Issues Mol Biol. .

Abstract

Aloe vera (A. vera) has been studied as a treatment option for ulcerative colitis (UC), but there is a lack of scientific evidence showing whether treatment with Aloe saponaria (A. saponaria) can also be beneficial. To investigate the therapeutic potential of A. saponaria as a treatment for UC, clinical symptoms, histopathological characteristics of the colon, inflammatory response, and toxicity were analyzed in dextran sulfate sodium (DSS)-induced UC mice after administration of aqueous extracts of A. saponaria (AAS) for 7 days. The total polyphenol and tannin content of AAS was 272 µg/g and 163 µg/g, respectively. AAS exhibited significant antioxidant activity. Several clinical symptoms, including body weight, colon length, and hematochezia, remarkably improved in the DSS+AAS treated group compared to the DSS+Vehicle-treated group. In addition, similar improvements were detected in the histopathological characteristics and mucin-secreting ability in the colon of DSS-induced UC mice after the administration of AAS. The levels of infiltrated inflammatory cells and cytokine expression were significantly decreased in a dose-dependent manner in the colon of the DSS+AAS-treated group. These alterations in inflammatory response were accompanied by a significant recovery of the protein kinase C/extracellular signal-regulated kinase (PKC/ERK) and phosphatidylinositol-3-kinase/serine-threonine protein kinase (PI3K/Akt) signaling pathways. However, the levels of key markers for hepatotoxicity and nephrotoxicity consistently remained between those of the DSS+AAS-treated and the No groups. Therefore, the results of the present study provide novel evidence that AAS may improve the clinical symptoms and attenuate the inflammatory response in DSS-induced UC mice and does not have any significant hepatotoxicity or nephrotoxicity.

Keywords: Aloe saponaria; dextran sulfate sodium; inflammation; toxicity; ulcerative colitis.


Conflict of interest statement

The authors declare no conflict of interest.

Figures

Figure 1
Figure 1
Morphology and biochemical properties of A. saponaria. (a) After drying the A. saponaria leaves completely, the leaves were powdered using a blender. This was used as the sample for further studies. (b) Total polyphenol and condensed tannin contents were determined at different concentrations of AAS. (c) DPPH radical scavenging activity was measured in a mixture including 0.1 mM DPPH and three concentrations of AAS (1, 2, and 4 mg/mL). These samples were assayed in duplicate by DPPH radical scavenging activity analysis. Data are reported as the mean ± SD. Abbreviations: AAS, aqueous extract of A. saponaria; DPPH, 1,1-diphenyl-2-picrylhydrazyl radical.
Figure 2
Figure 2
Clinical symptoms in DSS+AAS-treated mice. (a) Survival rate during the 7 days of treatment. Survival rate was monitored in all mice of the subset groups, as described in Materials and Methods section. (b) DAI score. This score was calculated by combining scores of three factors including body weight loss, stool consistency, and gross bleeding. (c) Changes in body weight during the 7 days of treatment. (d) Body weight at 7th day. The body weight of No, DSS+Vehicle, DSS+LAAS and DSS+HAAS-treated groups were measured from 0 to 7 days weeks, using a chemical balance. (e) Actual image of colon. After collection of colons, the total length from caecum to anus was measured using a ruler. Their morphology was observed using a digital camera. (f) Length of colons. This value is represented as a bar graph and statistical significance is indicated. Seven mice per group were used to prepare the clinical symptom analysis, and survival rate, DAI score, body weight and colon length analysis were measured in duplicate. The data are reported as the mean ± SD. *, p < 0.05 relative to the No group. #, p < 0.05 relative to the DSS+Vehicle-treated group. Abbreviations: AAS, aqueous extract of A. saponaria; DSS, Dextran sodium sulfate; DAI, Disease activity index; No: Non-UC group; LAAS: Low dose of AAS; HAAS: High dose of AAS; PC, Proximal colon; MC, Mid colon; DC, Distal colon.
Figure 2
Figure 2
Clinical symptoms in DSS+AAS-treated mice. (a) Survival rate during the 7 days of treatment. Survival rate was monitored in all mice of the subset groups, as described in Materials and Methods section. (b) DAI score. This score was calculated by combining scores of three factors including body weight loss, stool consistency, and gross bleeding. (c) Changes in body weight during the 7 days of treatment. (d) Body weight at 7th day. The body weight of No, DSS+Vehicle, DSS+LAAS and DSS+HAAS-treated groups were measured from 0 to 7 days weeks, using a chemical balance. (e) Actual image of colon. After collection of colons, the total length from caecum to anus was measured using a ruler. Their morphology was observed using a digital camera. (f) Length of colons. This value is represented as a bar graph and statistical significance is indicated. Seven mice per group were used to prepare the clinical symptom analysis, and survival rate, DAI score, body weight and colon length analysis were measured in duplicate. The data are reported as the mean ± SD. *, p < 0.05 relative to the No group. #, p < 0.05 relative to the DSS+Vehicle-treated group. Abbreviations: AAS, aqueous extract of A. saponaria; DSS, Dextran sodium sulfate; DAI, Disease activity index; No: Non-UC group; LAAS: Low dose of AAS; HAAS: High dose of AAS; PC, Proximal colon; MC, Mid colon; DC, Distal colon.
Figure 3
Figure 3
Histopathological characteristics and mucin secretion in the colon of DSS+AAS-treated mice. (a) Histological structure. Colon tissues were stained with H&E and cellular morphology was viewed at 100× and 400× magnification. (b) Histopathological score. This was determined based on the severity of inflammation, the extent of inflammation, and crypt damage. (c,d) Mucin staining analyses. Mucin secreted from the crypt layer cells was stained with Alcian blue at pH 2.5, and images were observed at 100× magnification. Three to five mice per group were used to prepare Alcian blue stained slides, and staining density was analyzed in duplicate for each slide. (e) Expression of MUC2. The levels of MUC2 transcripts in the total mRNA of mid colons were measured by RT-qPCR using specific primers. The mRNA level of this gene was calculated, based on the intensity of GAPDH as an endogenous control. Five to seven mice per group were used to prepare Histopathological characteristics and mucin secretion analyses, and H&E staining, mucin staining, and RT-qPCR was analyzed in duplicate for each sample. The data are reported as the mean ± SD. *, p < 0.05 relative to the No group. #, p < 0.05 relative to the DSS+Vehicle-treated group. Abbreviation: Abbreviation: AAS, aqueous extract of A. saponaria; DSS, Dextran sodium sulfate; No: Non-UC group; LAAS: Low dose of AAS; HAAS: High dose of AAS; H&E stain: hematoxylin and eosin stain; MUC2, Mucin 2; RT-qPCR: Quantitative Real Time-PCR.
Figure 3
Figure 3
Histopathological characteristics and mucin secretion in the colon of DSS+AAS-treated mice. (a) Histological structure. Colon tissues were stained with H&E and cellular morphology was viewed at 100× and 400× magnification. (b) Histopathological score. This was determined based on the severity of inflammation, the extent of inflammation, and crypt damage. (c,d) Mucin staining analyses. Mucin secreted from the crypt layer cells was stained with Alcian blue at pH 2.5, and images were observed at 100× magnification. Three to five mice per group were used to prepare Alcian blue stained slides, and staining density was analyzed in duplicate for each slide. (e) Expression of MUC2. The levels of MUC2 transcripts in the total mRNA of mid colons were measured by RT-qPCR using specific primers. The mRNA level of this gene was calculated, based on the intensity of GAPDH as an endogenous control. Five to seven mice per group were used to prepare Histopathological characteristics and mucin secretion analyses, and H&E staining, mucin staining, and RT-qPCR was analyzed in duplicate for each sample. The data are reported as the mean ± SD. *, p < 0.05 relative to the No group. #, p < 0.05 relative to the DSS+Vehicle-treated group. Abbreviation: Abbreviation: AAS, aqueous extract of A. saponaria; DSS, Dextran sodium sulfate; No: Non-UC group; LAAS: Low dose of AAS; HAAS: High dose of AAS; H&E stain: hematoxylin and eosin stain; MUC2, Mucin 2; RT-qPCR: Quantitative Real Time-PCR.
Figure 4
Figure 4
Expression level of pro-inflammatory cytokines in DSS-induced UC model after administration of AAS. The levels of TNF-α (a), IL-1β (b), IL-6 (c), and IL-10 (d) transcripts were detected in the total mRNA of colon tissue by performing qRT-PCR with specific primers. Five to seven mice per group were used to prepare the total RNAs, and qRT-PCR was performed in duplicate for each sample. Data are reported as the mean ± SD. *, p < 0.05 relative to the No group. #, p < 0.05 relative to the DSS+Vehicle-treated group. Abbreviation: AAS, aqueous extract of A. saponaria; RT-qPCR, quantitative real time-PCR; TNF-α, Tumor necrosis factor-alpha; IL, Interleukin.
Figure 4
Figure 4
Expression level of pro-inflammatory cytokines in DSS-induced UC model after administration of AAS. The levels of TNF-α (a), IL-1β (b), IL-6 (c), and IL-10 (d) transcripts were detected in the total mRNA of colon tissue by performing qRT-PCR with specific primers. Five to seven mice per group were used to prepare the total RNAs, and qRT-PCR was performed in duplicate for each sample. Data are reported as the mean ± SD. *, p < 0.05 relative to the No group. #, p < 0.05 relative to the DSS+Vehicle-treated group. Abbreviation: AAS, aqueous extract of A. saponaria; RT-qPCR, quantitative real time-PCR; TNF-α, Tumor necrosis factor-alpha; IL, Interleukin.
Figure 5
Figure 5
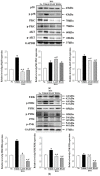
PI3K/Akt signaling pathway and PKC/ERK signaling pathway in DSS+AAS-treated mice. (a) Level of key members in the PI3K/Akt signaling pathways. Expression levels of six proteins were determined using an imaging densitometer. The level of each protein is presented relative to the intensity of GAPDH. (b) Level of key members in PKC/ERK signaling pathway. Expression levels of six proteins were determined using an imaging densitometer. The level of each protein is presented relative to the intensity of GAPDH. Five to seven mice per group were used to prepare tissue homogenates, and Western blot analysis was performed in duplicate for each sample. Data are reported as the mean ± SD. *, p < 0.05 relative to the No group. #, p < 0.05 relative to the DSS+Vehicle-treated group. Abbreviation: AAS, aqueous extract of A. saponaria; PKC, Protein kinase C; Akt, Serine-threonine protein kinase; ERK, Extracellular signal regulated kinase; PI3K, Phosphoinositide 3-kinase; JNK, c-Jun N-terminal kinase.
Figure 6
Figure 6
Histopathological features of the liver and kidney in DSS+AAS-treated mice. (a) Structure around the pericentral region in liver. (b) Structure around of the periportal region in liver. (c) Tubule region in kidney. (d) Glomerulus region in kidney. Liver and kidney tissues were stained with H&E and cellular morphology was viewed at 400× magnification. Five to seven mice per group per group were used to prepare H&E stained tissue slides, and histopathological alterations were analyzed in duplicate for each sample. Abbreviation: AAS, aqueous extract of A. saponaria; C, Central vein; H, Hepatocytes; E, Endothelial cells; V, Portal vein.; H&E stain: hematoxylin and eosin stain; G, Glomeruli; BS, Bowman’s space; P, proximal convoluted tubule; D, distal convoluted tubule.

References

    1. Baumgart D.C., Sandborn W.J. Inflammatory bowel disease: Clinical aspects and established and evolving therapies. Lancet. 2007;369:1641–1657. - PubMed
    1. Gajendran M., Loganathan P., Jimenez G., Catinella A.P., Ng N., Umapathy C., Ziade N., Hashash J.G. A comprehensive review and update on ulcerative colitis. Dis. A Mon. 2019;65:100851. - PubMed
    1. Lombardi V.R., Etcheverría I., Carrera I., Cacabelos R., Chacón A.R. Prevention of chronic experimental colitis induced by dextran sulphate sodium (DSS) in mice treated with FR91. J. Biomed. Biotechnol. 2012;2012:826178. doi: 10.1155/2012/826178. - DOI - PMC - PubMed
    1. Turner D., Levine A., Escher J.C., Griffiths A.M., Russell R.K., Dignass A., Dias J.A., Bronsky J., Braegger C.P., Cucchiara S., et al. Management of pediatric ulcerative colitis: Joint ECCO and ESPGHAN evidence-based consensus guidelines. J. Pediatr. Gastroenterol. Nutr. 2012;55:340–361. doi: 10.1097/MPG.0b013e3182662233. - DOI - PubMed
    1. Bentley E., Jenkins D., Campbell F., Warren B. How could pathologists improve the initial diagnosis of colitis? Evidence from an international workshop. J. Clin. Pathol. 2002;55:955–960. - PMC - PubMed

LinkOut - more resources