Review
. 2023 Feb 13;9(2):153.
doi: 10.3390/gels9020153.

Nanocomposite Hydrogels as Functional Extracellular Matrices

Affiliations
Review

Nanocomposite Hydrogels as Functional Extracellular Matrices

Stijn Jooken et al. Gels. .

Abstract

Over recent years, nano-engineered materials have become an important component of artificial extracellular matrices. On one hand, these materials enable static enhancement of the bulk properties of cell scaffolds, for instance, they can alter mechanical properties or electrical conductivity, in order to better mimic the in vivo cell environment. Yet, many nanomaterials also exhibit dynamic, remotely tunable optical, electrical, magnetic, or acoustic properties, and therefore, can be used to non-invasively deliver localized, dynamic stimuli to cells cultured in artificial ECMs in three dimensions. Vice versa, the same, functional nanomaterials, can also report changing environmental conditions-whether or not, as a result of a dynamically applied stimulus-and as such provide means for wireless, long-term monitoring of the cell status inside the culture. In this review article, we present an overview of the technological advances regarding the incorporation of functional nanomaterials in artificial extracellular matrices, highlighting both passive and dynamically tunable nano-engineered components.

Keywords: biosensing; nanocomposite hydrogel; nanoparticles; remote stimulation.


Conflict of interest statement

The authors declare no conflict of interest.

Figures

Figure 1
Figure 1
Material toolbox available for mimicking the cell microenvironment. Parts of this figure are adapted with permission from Ref. [6]. Copyright 2017 American Chemical Society.
Figure 2
Figure 2
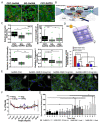
Directional cell growth on magnetically aligned nanocomposite hydrogels. (A) Fluorescence image of human mesenchymal stem cells on top of GelMA containing 1. non-oriented IONPs (scalebar 400 µm) 2. oriented IONP filaments (scalebar 400 µm) 3. oriented IONP filaments (scalebar 100 µm). (B) Fluorescence images of D API (blue) and phalloidin (green) stained C2C12 differentiated cells with (+HS) and without (−HS) horse serum, cultured on top of GelMA (G), GelMA with non-oriented IONPs (G/RIOPs), and GelMA with oriented IONP filaments (G/AIOPs) (scale bar 20 µm). (C) Fluorescence image of DRG (red, Alexa fluor 633) cultured in a fibrin hydrogel with 3 vol% of IONP-PLGA microgels (green, fluorescein) both randomly oriented and aligned (scale bar 200 µm). (D) Distribution of neurite orientation starting at the white full circle. The edge of the DRG body is marked by the white dotted circle. Panels (A,B) are reprinted with permission from Ref. [103]. Copyright 2019 Wiley. Panels (C,D) are reprinted with permission from Ref. [106]. Copyright 2017 American Chemical Society.
Figure 3
Figure 3
(A) Cardiac phenotypes on CNT-, GO-, and rGO-GelMA nanocomposite scaffolds. Fluorescence microscopy image of cardiomyocyte culture, labeled for sarcomeric α-actinin (green), Cx-43 (red), and nuclei (blue). (B) Schematic representation of important functional proteins during cardiomyocyte maturation. (C) Relative intensity of vinculin, z-line length of sarcomeric α-actinin, connexin-43, and Tropinin I after 5 days of culture as determined from microscopy images as shown in panel (A) (* p < 0.05, ** p < 0.005, *** p < 0.005). (D) Schematic illustration of stem cell culture of mouse embryoid bodies (EBs) in GelMA containing 0.5 mg/mL random or aligned CNTs with electrical stimulation (ES) of 1 Hz, 3V and the percentage of beating EBs on pristine GelMA and CNT-GelMA in the presence (+ES) and absence (−ES) of electrical stimulation after cardiac differentiation. (* p < 0.05) E) Fluorescence confocal microscopy image showing F-actin (green) and nucleus (blue) staining of cardiomyocytes cultured within GelMA and GelMA-GNR hydrogels for 7 days. The inset shows the Fourier transform, indicating local alignment of the F-actin fibers (indicated with white arrows). Scale bar 50 µm. (F) The alignment distribution for the nuclei from panel (D), indicating no global alignment of the nuclei within the (GNR-)GelMA scaffolds. (G) Synchronized beat rates from day 3 to day 5 for the various GNR-GelMA scaffolds shown in panel (D). (* p < 0.05) Panels (AC) reprinted with permission from Ref. [133]. Copyright 2019 American Chemical Society. Panel (D) reprinted with permission from Ref. [82]. Copyright 2016 Elsevier. Panels (EG) reprinted with permission from Ref. [137]. Copyright 2016 Elsevier.
Figure 4
Figure 4
Opto-electric cell stimulation using QDs. (A) Schematic illustration of the interaction of a quantum dot with the cell membrane. (B) The voltage response of a current-clamped cortical neuron cultured on a CdSe QD film. (C) The current response of a voltage-clamped cortical neuron on a CdSe QD film. The figure is reprinted with permission from Ref. [187]. Copyright 2012 Optical Society of America.
Figure 5
Figure 5
GNP-based optomechanical hydrogel actuation. (A) Illustration of a 3D GNR-PEG nanocomposite hydrogel for cell mechanical actuation and (B) an encapsulated SH-SY5Y cell ‘beating’ in response to 1 Hz NIR laser stimulation. (C) Illustration of the operating principle of PNIPMAM-encapsulated GNRs and (D) TEM-image of the NPs (Scale bar 1 μm, inset scale bar 200 nm), the hydrodynamic diameter as a function of temperature as measured by dynamic light scattering and the UV-vis-NIR absorbance spectrum at 25 °C and 55 °C with n red the NIR wavelength used for remote actuation. (E) GNR heating deforms a PNIPAM matrix exerting stress on the cell, cultured on top. The flexible nanowires embedded in the hydrogel translate the deformation into a force. (F) Epifluorescence images of the cells (1, 3) and brightfield images of the underlying microstructures (2, 4). The laser is focused at the center of the dashed circle that outlines the area where the hydrogel is contracted. Images (1, 2) indicate the start of the experiment, while (3, 4) are the same cells 3 s after 18 mW laser illumination. The locations of two microstructures at both timepoints are marked by the yellow dashed lines, and the elongation from 9 µm (2) to 13 µm (4) is indicated by the yellow arrows. Scale bars are 10 µm. Panels (A,B) are reprinted with permission from Ref. [211]. Copyright 2022 Wiley. Panels (C,D) are reprinted with permission from Ref. [210]. Copyright 2020 American Chemical Society. Panels (E,F) are reprinted with permission from Ref. [207].
Figure 6
Figure 6
Electrochemical monitoring in 3D scaffolds. (A) Schematic representation of a 3D planar electrode impedance sensor for bulk monitoring of cell proliferation in 3D systems and (B) normalized cell growth curves as measured by 2D electric cell-substrate impedance sensing (ECIS) and 3D electric cell/matrigel-substrate impedance sensing (ECMIS) of 2D and 3D cultures of HpeG2 cells on top/within, treated with different 10 µL of the anti-cancer drugs Cisplatin, Taxol and Sorafenib. The cell index (CI) value represents normalized impedance change. The (fluorescence) microscopy images display cell morphology and live/dead staining of the different conditions in 3D ECMIS after 96 h. (C) Schematic representation of a PCP/Pt 3D electrochemical scaffold. (D) Picture of the PCP/Pt scaffold in cell culture. (E) Amplitude of the amperometric response of the PCP/Pt scaffold (vs. Ag/AgCl) upon the addition of 2 µL DSF-CuCl2 and NMS873 to MCF-7 (red trace), Hela (blue trace) and HUVEC (black trace) cells cultured for 5h on the electrochemical scaffold. (F) Transient amperometric response of the cells to 2 µL of the anti-cancer drugs DSF-CuCl2 and NMS873 corresponding to the data in panel (E). Panels (A,B) are reprinted with permission from Ref. [254]. Copyright 2019 Elsevier. Panels (CF) are reprinted with permission from Ref. [257]. Copyright 2019 American Chemical Society.

Similar articles

Cited by

References

    1. Parks W.C., Mecham R.P., editors. Extracellular Matrix Degradation. Volume 1. Springer; Berlin/Heidelberg, Germany: 2011.
    1. Wheeldon I., Farhadi A., Bick A.G., Jabbari E., Khademhosseini A. Nanoscale Tissue Engineering: Spatial Control over Cell-Materials Interactions. Nanotechnology. 2011;22:212001. doi: 10.1088/0957-4484/22/21/212001. - DOI - PMC - PubMed
    1. Nicolas J., Magli S., Rabbachin L., Sampaolesi S., Nicotra F., Russo L. 3D Extracellular Matrix Mimics: Fundamental Concepts and Role of Materials Chemistry to Influence Stem Cell Fate. Biomacromolecules. 2020;21:1968–1994. doi: 10.1021/acs.biomac.0c00045. - DOI - PubMed
    1. Cai S., Wu C., Yang W., Liang W., Yu H., Liu L. Recent Advance in Surface Modification for Regulating Cell Adhesion and Behaviors. Nanotechnol. Rev. 2020;9:971–989. doi: 10.1515/ntrev-2020-0076. - DOI
    1. Kshitiz, Park J., Kim P., Helen W., Engler A.J., Levchenko A., Kim D.-H. Control of Stem Cell Fate and Function by Engineering Physical Microenvironments. Integr. Biol. 2012;4:1008–1018. doi: 10.1039/c2ib20080e. - DOI - PMC - PubMed

LinkOut - more resources