. 2023 Jan 23;10(2):39.
doi: 10.3390/jcdd10020039.

Cardiovascular and Renal Comorbidities Included into Neural Networks Predict the Outcome in COVID-19 Patients Admitted to an Intensive Care Unit: Three-Center, Cross-Validation, Age- and Sex-Matched Study

Affiliations

Cardiovascular and Renal Comorbidities Included into Neural Networks Predict the Outcome in COVID-19 Patients Admitted to an Intensive Care Unit: Three-Center, Cross-Validation, Age- and Sex-Matched Study

Evgeny Ovcharenko et al. J Cardiovasc Dev Dis. .

Abstract

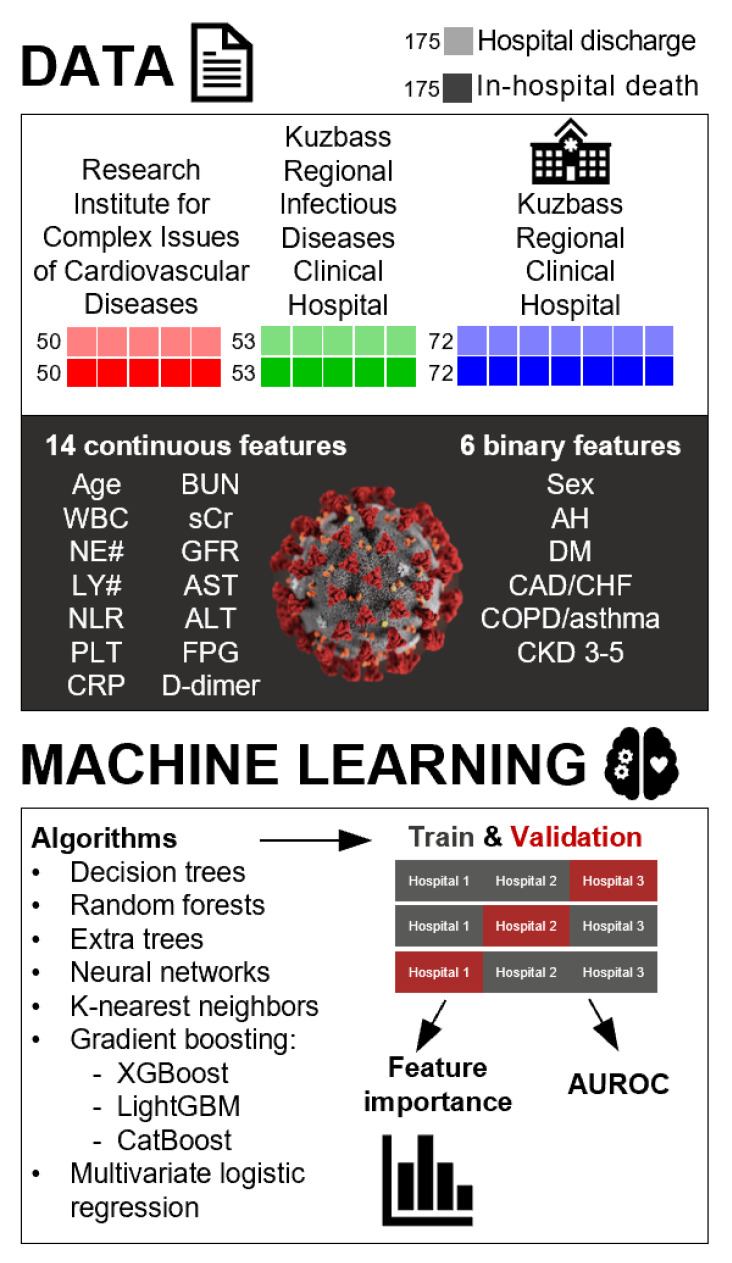
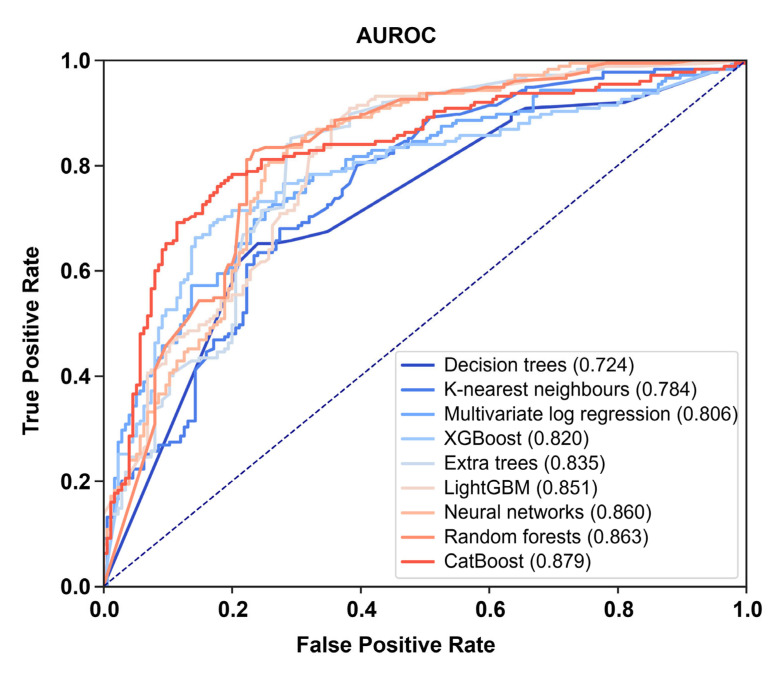
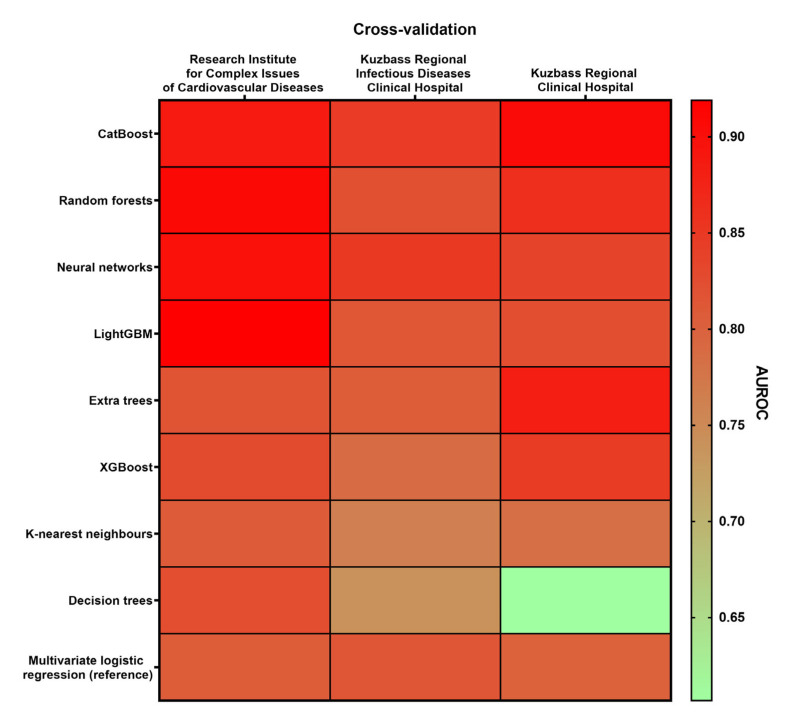
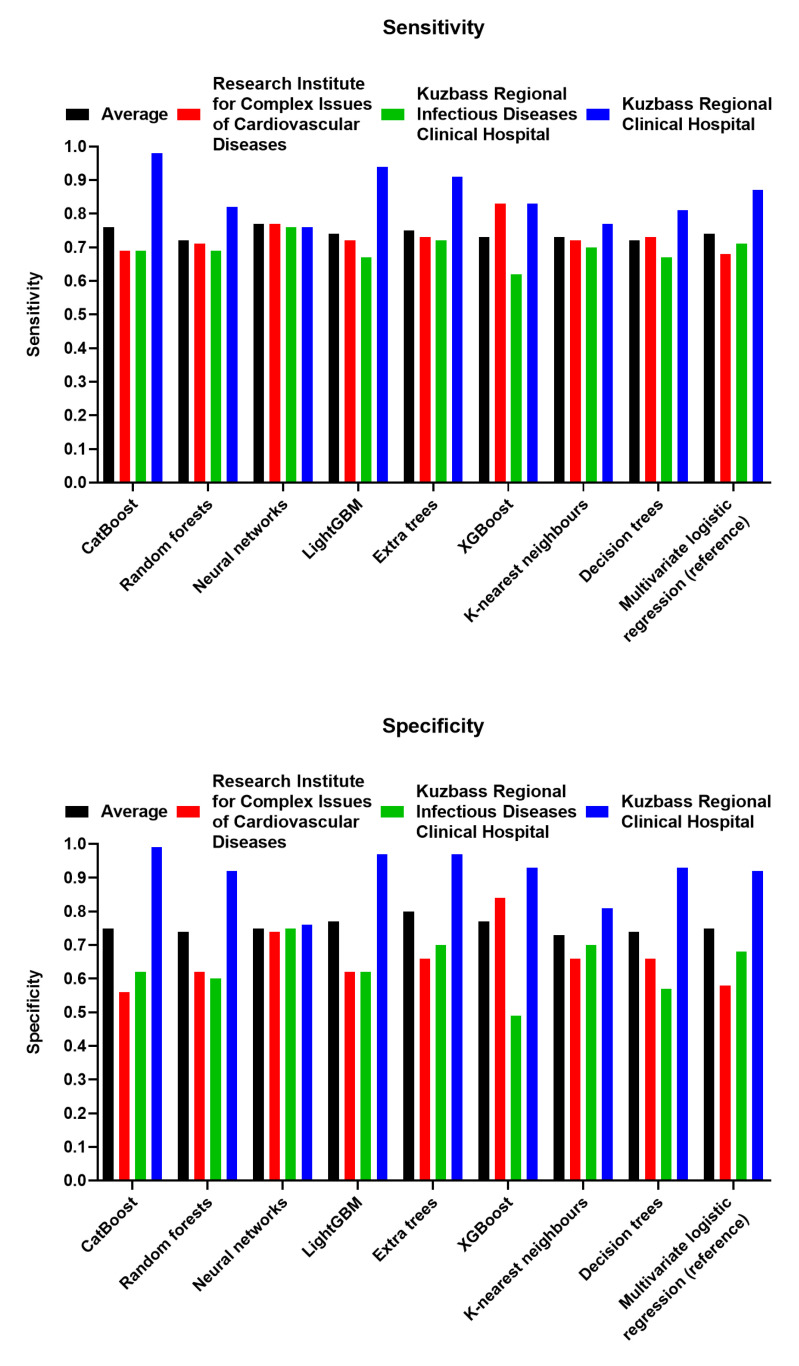
Here, we performed a multicenter, age- and sex-matched study to compare the efficiency of various machine learning algorithms in the prediction of COVID-19 fatal outcomes and to develop sensitive, specific, and robust artificial intelligence tools for the prompt triage of patients with severe COVID-19 in the intensive care unit setting. In a challenge against other established machine learning algorithms (decision trees, random forests, extra trees, neural networks, k-nearest neighbors, and gradient boosting: XGBoost, LightGBM, and CatBoost) and multivariate logistic regression as a reference, neural networks demonstrated the highest sensitivity, sufficient specificity, and excellent robustness. Further, neural networks based on coronary artery disease/chronic heart failure, stage 3-5 chronic kidney disease, blood urea nitrogen, and C-reactive protein as the predictors exceeded 90% sensitivity and 80% specificity, reaching AUROC of 0.866 at primary cross-validation and 0.849 at secondary cross-validation on virtual samples generated by the bootstrapping procedure. These results underscore the impact of cardiovascular and renal comorbidities in the context of thrombotic complications characteristic of severe COVID-19. As aforementioned predictors can be obtained from the case histories or are inexpensive to be measured at admission to the intensive care unit, we suggest this predictor composition is useful for the triage of critically ill COVID-19 patients.

Keywords: C-reactive protein; COVID-19; blood urea nitrogen; chronic kidney disease; coronary artery disease; lymphocyte count; machine learning; neural networks; neutrophil-to-lymphocyte ratio; prognostication.


Conflict of interest statement

The authors declare no conflict of interest. The funders had no role in the design of the study; in the collection, analyses, or interpretation of data; in the writing of the manuscript; or in the decision to publish the results.

Figures

Figure 1
Figure 1
Study design. The patients (n = 350) enrolled from three centers (Research Institute for Complex Issues of Cardiovascular Diseases, n = 100; Kuzbass Regional Infectious Diseases Clinical Hospital, n = 106; Kuzbass Regional Clinical Hospital, n = 144) have been pre-matched (1:1) by age, sex (male or female), and outcome (in-hospital death or hospital discharge). This patient dataset has been employed for the ML by a number of algorithms (decision trees, random forests, extra trees, neural networks, k-nearest neighbors, gradient boosting: XGBoost, LightGBM, and CatBoost) and multivariate logistic regression as a reference. In total, we assessed 14 continuous variables (age, WBC, NE#, LY#, NLR, PLT, BUN, sCr, GFR, AST, ALT, FPG, CRP, and D-dimer) and 6 binary variables (sex and past/present medical history of AH, DM, CAD/CHF, COPD/asthma, and stage 3–5 CKD) which were measured at the admission to the ICU. The outcome was binary (in-hospital death or hospital discharge). ML and cross-validation were performed either on a general dataset (70:30 learning:cross-validation samples proportion) or on all combinations of two sub-datasets from separate hospitals (Research Institute for Complex Issues of Cardiovascular Diseases and Kuzbass Regional Infectious Diseases Clinical Hospital, n = 206; Research Institute for Complex Issues of Cardiovascular Diseases and Kuzbass Regional Clinical Hospital, n = 244; Kuzbass Regional Infectious Diseases Clinical Hospital and Kuzbass Regional Clinical Hospital, n = 250) using the third dataset (Kuzbass Regional Clinical Hospital, n = 144; Kuzbass Regional Infectious Diseases Clinical Hospital, n = 106; Research Institute for Complex Issues of Cardiovascular Diseases, n = 100, respectively) as a cross-validation sample. The efficiency of the ML algorithms and tools was evaluated by AUROC, percent of correct predictions (%sensitivity and %specificity), and the range of these parameters between the distinct study centers.
Figure 2
Figure 2
Correlation analysis (Spearman’s rank correlation coefficient) of continuous predictors. Heat map, different shades of blue (from light blue to dark blue) indicate correlation coefficients from −0.01 to −1.0, respectively; different shades of red (from pink to scarlet) indicate correlation coefficients from 0.01 to 1.0, respectively. AH—arterial hypertension, DM—diabetes mellitus, CAD—coronary artery disease. CHF—chronic heart failure, COPD—chronic obstructive pulmonary disease, CKD—chronic kidney disease, WBC—white blood cell count, NE#—neutrophil count, LY#—lymphocyte count, NLR—neutrophil-to-lymphocyte ratio, PLT—platelet count, BUN—blood urea nitrogen, sCr—serum creatinine. GFR—glomerular filtration rate, AST—aspartate aminotransferase, ALT—alanine aminotransferase, FPG—fasting plasma glucose, CRP—C-reactive protein.
Figure 3
Figure 3
ROC curves and AUROC values for the best models developed by distinct ML algorithms.
Figure 4
Figure 4
Heat map demonstrating the variability of AUROC in different combinations of learning and cross-validation samples. The color range from green to red indicates the ascending AUROC (the lowest and the highest AUROC are marked green and red, respectively). Left column: learning dataset: Kuzbass Regional Infectious Diseases Clinical Hospital and Kuzbass Regional Clinical Hospital (n = 250), cross-validation dataset: Research Institute for Complex Issues of Cardiovascular Diseases (n = 100). Central column: learning dataset: Research Institute for Complex Issues of Cardiovascular Diseases and Kuzbass Regional Clinical Hospital (n = 244), cross-validation dataset: Kuzbass Regional Infectious Diseases Clinical Hospital (n = 106). Right column: learning dataset: Research Institute for Complex Issues of Cardiovascular Diseases and Kuzbass Regional Infectious Diseases Clinical Hospital (n = 206), cross-validation dataset: Kuzbass Regional Clinical Hospital (n = 144).
Figure 5
Figure 5
Sensitivity (top) and specificity (bottom) of the employed ML algorithms. Black color: average value across three centers, red color: Research Institute for Complex Issues of Cardiovascular Diseases (n = 100); green color: Kuzbass Regional Infectious Diseases Clinical Hospital (n = 106); blue color: Kuzbass Regional Clinical Hospital (n = 144).

Similar articles

Cited by

References

    1. WHO Coronavirus (COVID-19) Dashboard. [(accessed on 27 November 2022)]. Available online: https://covid19.who.int/
    1. Kamran F., Tang S., Otles E., McEvoy D.S., Saleh S.N., Gong J., Li B.Y., Dutta S., Liu X., Medford R.J., et al. Early identification of patients admitted to hospital for COVID-19 at risk of clinical deterioration: Model development and multisite external validation study. BMJ. 2022;376:e068576. doi: 10.1136/bmj-2021-068576. - DOI - PMC - PubMed
    1. Yadaw A.S., Li Y.C., Bose S., Iyengar R., Bunyavanich S., Pandey G. Clinical features of COVID-19 mortality: Development and validation of a clinical prediction model. Lancet Digit. Health. 2020;2:e516–e525. doi: 10.1016/S2589-7500(20)30217-X. - DOI - PMC - PubMed
    1. Rasmy L., Nigo M., Kannadath B.S., Xie Z., Mao B., Patel K., Zhou Y., Zhang W., Ross A., Xu H., et al. Recurrent neural network models (CovRNN) for predicting outcomes of patients with COVID-19 on admission to hospital: Model development and validation using electronic health record data. Lancet Digit. Health. 2022;4:e415–e425. doi: 10.1016/S2589-7500(22)00049-8. - DOI - PMC - PubMed
    1. Jiao Z., Choi J.W., Halsey K., Tran T.M.L., Hsieh B., Wang D., Eweje F., Wang R., Chang K., Wu J., et al. Prognostication of patients with COVID-19 using artificial intelligence based on chest x-rays and clinical data: A retrospective study. Lancet Digit. Health. 2021;3:e286–e294. doi: 10.1016/S2589-7500(21)00039-X. - DOI - PMC - PubMed