Review
. 2023 Jan 30;9(2):31.
doi: 10.3390/jimaging9020031.

NaF-PET Imaging of Atherosclerosis Burden

Affiliations
Review

NaF-PET Imaging of Atherosclerosis Burden

Poul F Høilund-Carlsen et al. J Imaging. .

Abstract

The method of 18F-sodium fluoride (NaF) positron emission tomography/computed tomography (PET/CT) of atherosclerosis was introduced 12 years ago. This approach is particularly interesting because it demonstrates microcalcification as an incipient sign of atherosclerosis before the development of arterial wall macrocalcification detectable by CT. However, this method has not yet found its place in the clinical routine. The more exact association between NaF uptake and future arterial calcification is not fully understood, and it remains unclear to what extent NaF-PET may replace or significantly improve clinical cardiovascular risk scoring. The first 10 years of publications in the field were characterized by heterogeneity at multiple levels, and it is not clear how the method may contribute to triage and management of patients with atherosclerosis, including monitoring effects of anti-atherosclerosis intervention. The present review summarizes findings from the recent 2¾ years including the ability of NaF-PET imaging to assess disease progress and evaluate response to treatment. Despite valuable new information, pertinent questions remain unanswered, not least due to a pronounced lack of standardization within the field and of well-designed long-term studies illuminating the natural history of atherosclerosis and effects of intervention.

Keywords: 18F-sodium fluoride; NaF; PET/CT; atherosclerosis; disease progression; intervention.


Conflict of interest statement

The authors declare no conflict of interest.

Figures

Figure 1
Figure 1
PRISMA Flow Diagram.
Figure 2
Figure 2
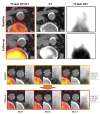
Appearance of Calcifications in Areas of Increased NaF Uptake and Evolution of “Hot” Plaques. Top panel: Fused and PET images show increased NaF uptake in the posterior and left lateral aortic wall (top row, left and right images, dashed outlines). At follow-up, two point-shaped calcifications have appeared (bottom row, left and center images, see arrowheads). Bottom panel: The upper series (orange box) shows three consecutive NaF-PET/CT and CT slices with mildly calcified plaques with co-localized increase in tracer uptake (dashed outlines). Follow-up images of the same slices (red box) show an increase in the lesions’ density and size, the extent of which is reflected by the increase in average HU and calcium score. TBR values were average SUV values normalized for inferior vena cava blood pool activity. Spill-over from nearby vertebrae were sought corrected for by means of brush tool editing observing a safety distance of 1 cm. Reprinted with permission from Fiz et al. [33], 2021, Springer Nature.
Figure 3
Figure 3
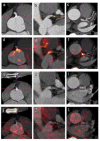
Reduced 18F-Sodium Fluoride Activity in Coronary Plaques after Statin Therapy. CT: single mixed plaque extending to the ostium and first segment of right coronary artery (RCA), smaller one in left main coronary artery (LM) and minor calcifications in left anterior descending artery (LAD); Agatston scores: ostium 198; RCA 169; LM 22; LAD 7 (panels (ac)). NaF-PET/CT: focal NaF uptake in ostium of RCA (panel d; SUVmax1.9) and in LM (panels (e and f); SUVmax 2.5). Six months later following a regimen of 10 mg rosuvastatine and 75 mg aspirin per day with advising of diet and regular physical activity, CT was unchanged with Agatston scores: ostium 195; RCA 163; LM 23, LAD 9, while there was a decrease in focal NaF uptake in the coronary plaques (panels (gl); respective SUVmax 1.2 and 1.5), without new hotspots. Reprinted with permission from Dietz et al. [44]). 2021, Oxford University Press.
Figure 4
Figure 4
Schematic representation of measurement NaF uptake and calculation of coronary microcalcification score (left) and arch of the aorta NaF activity (right). Reproduced from Fletcher, A.J et al. [40], an open access article under the CC BY license.
Figure 5
Figure 5
Artificial Intelligence-Based Segmentation of the Aorta. Convolutional neural networks trained on manually annotated non-contrast CT images allows reconstruction of the arch of aorta (a), thoracic aorta (b), and abdominal aorta (c). After identifying the edge of the aorta, segmentation of the wall (not shown) is made by including all voxels lying within 3 mm of the edge of the aorta segmentation on the inside and within 2 mm of the edge on the outside, yielding a 5 mm thick wall following the edge of the aorta segmentation output from the segmentation tool. This yielded a 5 mm thick wall following the edge of the aorta. Values obtained with this approach for average NaF SUVmean uptake in the walls of three sections were very virtually identical to values obtained by manual segmentation. Reprinted with permission from Piri et al. [71]). 2021, Springer Nature.

References

    1. Derlin T., Richter U., Bannas P., Begemann P., Buchert R., Mester J., Klutmann S. Feasibility of 18F-sodium fluoride PET/CT for imaging of atherosclerotic plaque. J. Nucl. Med. 2010;51:862–865. doi: 10.2967/jnumed.110.076471. - DOI - PubMed
    1. Høilund-Carlsen P.F., Piri R., Constantinescu C., Iversen K.K., Werner T.J., Sturek M., Alavi A., Gerke O. Atherosclerosis Imaging with 18F-Sodium Fluoride PET. Diagnostics. 2020;10:852. doi: 10.3390/diagnostics10100852. - DOI - PMC - PubMed
    1. Høilund-Carlsen P.F., Sturek M., Alavi A., Gerke O. Atherosclerosis imaging with 18F-sodium fluoride PET: State-of-the-art review. Eur. J. Nucl. Med. Mol. Imaging. 2020;47:1538–1551. doi: 10.1007/s00259-019-04603-1. - DOI - PMC - PubMed
    1. Shamseer L., Moher D., Clarke M., Ghersi D., Liberati A., Petticrew M., Shekelle P., Stewart L.A., PRISMA-P Group Preferred reporting items for systematic review and meta-analysis protocols (PRISMA-P) 2015: Elaboration and explanation. B.M.J. 2015;350:g7647. doi: 10.1136/bmj.g7647. - DOI - PubMed
    1. Zhuang X., Feng Y., Li J., Zhao F., Zhang Y., Chen Y. A longitudinal 18F-fluorodeoxyglucose (18F-FDG) and 18F-sodium fluoride (18F-NaF) positron emission tomography/computed tomography (PET/CT) study in apolipoprotein E (ApoE) knockout rats fed with a Western diet. Cardiovasc. Diagn. Ther. 2021;11:39–49. doi: 10.21037/cdt-20-609. - DOI - PMC - PubMed

LinkOut - more resources