

Global Diabetes Prevalence in COVID-19 Patients and Contribution to COVID-19- Related Severity and Mortality: A Systematic Review and Meta-analysis
- PMID: 36826982
- PMCID: PMC10090902
- DOI: 10.2337/dc22-1943
Global Diabetes Prevalence in COVID-19 Patients and Contribution to COVID-19- Related Severity and Mortality: A Systematic Review and Meta-analysis
Abstract
Background: COVID-19 and diabetes both contribute to large global disease burdens.
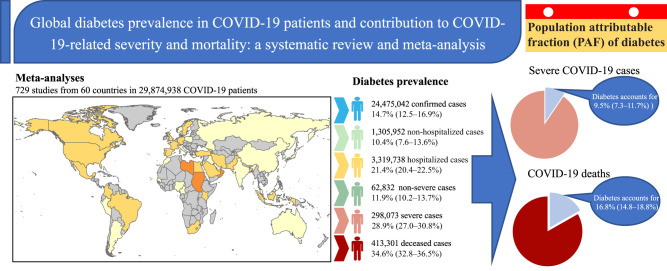
Purpose: To quantify the prevalence of diabetes in various COVID-19 disease stages and calculate the population attributable fraction (PAF) of diabetes to COVID-19-related severity and mortality.
Data sources: Systematic review identified 729 studies with 29,874,938 COVID-19 patients.
Study selection: Studies detailed the prevalence of diabetes in subjects with known COVID-19 diagnosis and severity.
Data extraction: Study information, COVID-19 disease stages, and diabetes prevalence were extracted.
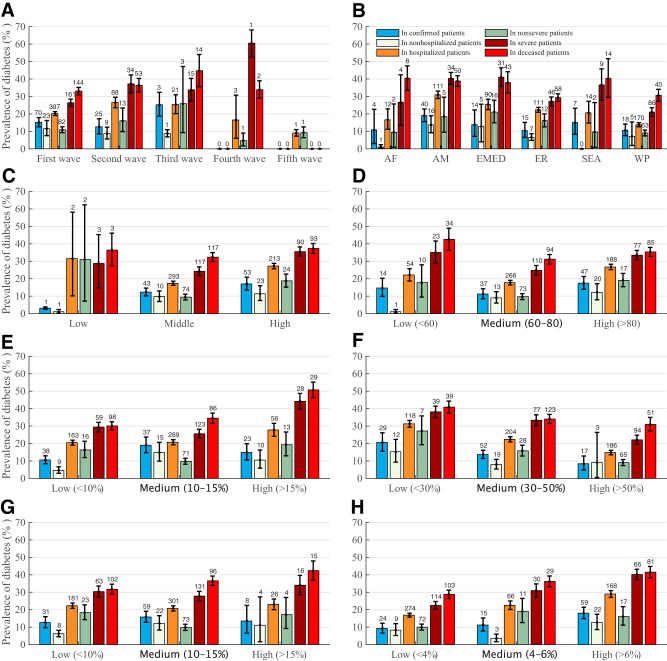
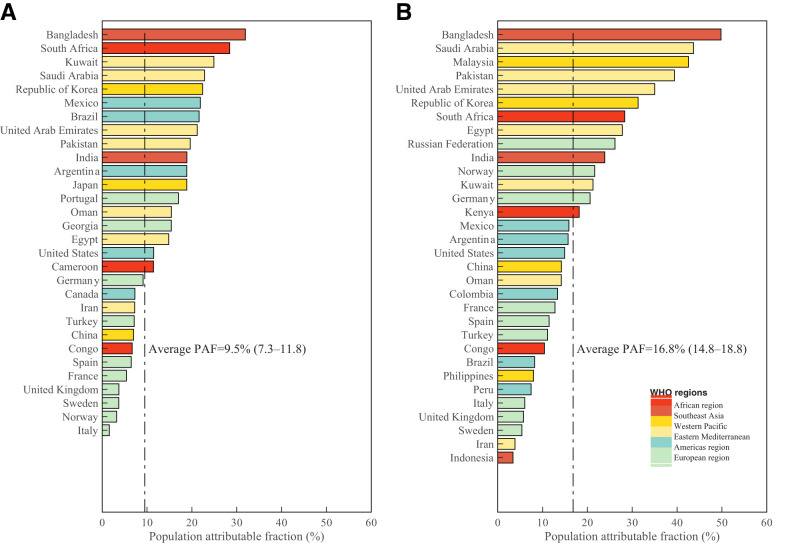
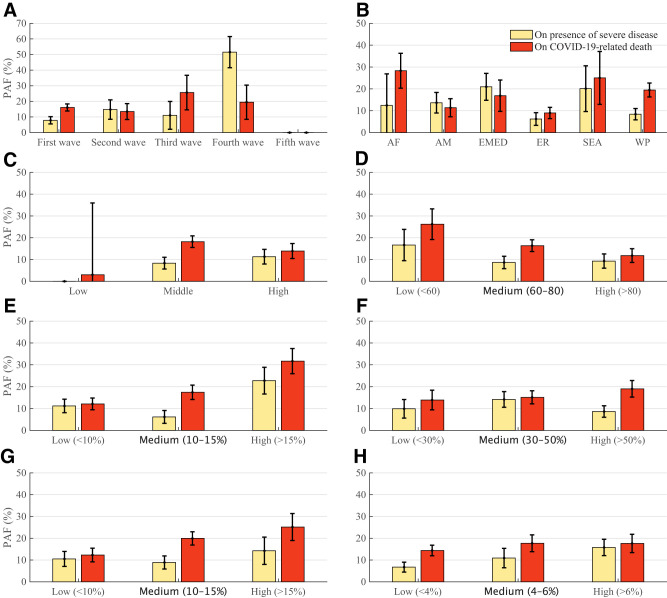
Data synthesis: The pooled prevalence of diabetes in stratified COVID-19 groups was 14.7% (95% CI 12.5-16.9) among confirmed cases, 10.4% (7.6-13.6) among nonhospitalized cases, 21.4% (20.4-22.5) among hospitalized cases, 11.9% (10.2-13.7) among nonsevere cases, 28.9% (27.0-30.8) among severe cases, and 34.6% (32.8-36.5) among deceased individuals, respectively. Multivariate metaregression analysis explained 53-83% heterogeneity of the pooled prevalence. Based on a modified version of the comparative risk assessment model, we estimated that the overall PAF of diabetes was 9.5% (7.3-11.7) for the presence of severe disease in COVID-19-infected individuals and 16.8% (14.8-18.8) for COVID-19-related deaths. Subgroup analyses demonstrated that countries with high income levels, high health care access and quality index, and low diabetes disease burden had lower PAF of diabetes contributing to COVID-19 severity and death.
Limitations: Most studies had a high risk of bias.
Conclusions: The prevalence of diabetes increases with COVID-19 severity, and diabetes accounts for 9.5% of severe COVID-19 cases and 16.8% of deaths, with disparities according to country income, health care access and quality index, and diabetes disease burden.
© 2023 by the American Diabetes Association.
Conflict of interest statement
Figures
References
-
- Johns Hopkins University . Coronavirus Resource Center: COVID-19 Tracking. Accessed 26 August 2022. Available from https://coronavirus.jhu.edu
-
- Yang JK, Feng Y, Yuan MY, et al. Plasma glucose levels and diabetes are independent predictors for mortality and morbidity in patients with SARS. Diabet Med 2006;23:623–628 - PubMed
Publication types
MeSH terms
LinkOut - more resources
Full Text Sources
Medical
