

Single-Molecule Sizing through Nanocavity Confinement
- PMID: 36826991
- PMCID: PMC9999452
- DOI: 10.1021/acs.nanolett.1c04830
Single-Molecule Sizing through Nanocavity Confinement
Abstract
An approach relying on nanocavity confinement is developed in this paper for the sizing of nanoscale particles and single biomolecules in solution. The approach, termed nanocavity diffusional sizing (NDS), measures particle residence times within nanofluidic cavities to determine their hydrodynamic radii. Using theoretical modeling and simulations, we show that the residence time of particles within nanocavities above a critical time scale depends on the diffusion coefficient of the particle, which allows the estimation of the particle's size. We demonstrate this approach experimentally through the measurement of particle residence times within nanofluidic cavities using single-molecule confocal microscopy. Our data show that the residence times scale linearly with the sizes of nanoscale colloids, protein aggregates, and single DNA oligonucleotides. NDS thus constitutes a new single molecule optofluidic approach that allows rapid and quantitative sizing of nanoscale particles for potential applications in nanobiotechnology, biophysics, and clinical diagnostics.
Keywords: biosensing; confocal detection; microfluidics; nanofluidics; protein sizing; single molecules.
Conflict of interest statement
The authors declare no competing financial interest.
Figures
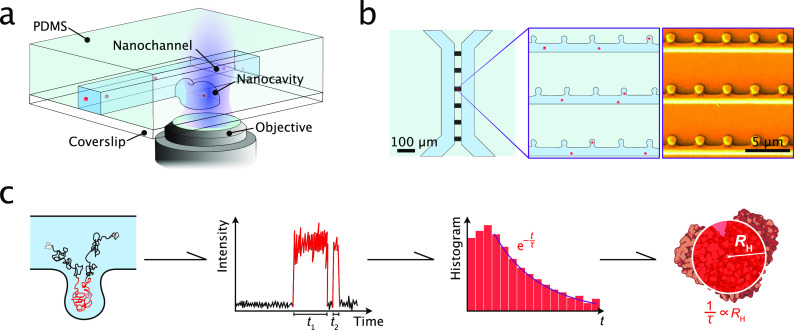
 , from which the hydrodynamic radius RH can be extracted. The coefficient τ
is inversely proportional to RH.
, from which the hydrodynamic radius RH can be extracted. The coefficient τ
is inversely proportional to RH.

 . The slope of the curves gives the decay
time. The dotted line corresponds to the critical time tc for each species. The error bars are standard deviations
of the Poisson distribution (
. The slope of the curves gives the decay
time. The dotted line corresponds to the critical time tc for each species. The error bars are standard deviations
of the Poisson distribution ( ), which was calculated from the number
of events per bin (N). The following number of single-molecule
events were probed in order to create residence time histograms: 45-bp
DNA, 969 events; α-synuclein oligomers, 1410 events; 50 nm colloids,
760 events; 20 nm colloids, 1137 events. (d) Extracted decay times
versus hydrodynamic radii. The dotted line is a linear fit of the
data points. Hydrodynamic radii for the colloids and the DNA were
measured by dynamic light scattering (DLS) and for the oligomers by
analytical ultracentrifugation (AUC). For a description of the error
bars, see Table 1.
), which was calculated from the number
of events per bin (N). The following number of single-molecule
events were probed in order to create residence time histograms: 45-bp
DNA, 969 events; α-synuclein oligomers, 1410 events; 50 nm colloids,
760 events; 20 nm colloids, 1137 events. (d) Extracted decay times
versus hydrodynamic radii. The dotted line is a linear fit of the
data points. Hydrodynamic radii for the colloids and the DNA were
measured by dynamic light scattering (DLS) and for the oligomers by
analytical ultracentrifugation (AUC). For a description of the error
bars, see Table 1.References
-
- Mudalige T.; Qu H.; Van Haute D.; Ansar S. M.; Paredes A.; Ingle T.. Characterization of Nanomaterials: Tools and Challenges. In Nanomaterials for Food Applications; Rubio A. L.; Rovira M. J. F.; Sanz M. M.; Gómez-Mascaraque L. G., Eds.; Elsevier, 2019; pp 313–353. 10.1016/B978-0-12-814130-4.00011-7. - DOI
Grants and funding
LinkOut - more resources
Full Text Sources
