

Antigen rapid tests, nasopharyngeal PCR and saliva PCR to detect SARS-CoV-2: A prospective comparative clinical trial
- PMID: 36827328
- PMCID: PMC9955963
- DOI: 10.1371/journal.pone.0282150
Antigen rapid tests, nasopharyngeal PCR and saliva PCR to detect SARS-CoV-2: A prospective comparative clinical trial
Abstract
Background: Nasopharyngeal antigen Rapid Diagnostic Tests (RDTs), saliva RT-PCR and nasopharyngeal (NP) RT-PCR have shown different performance characteristics to detect patients infected by SARS-CoV-2, according to the viral load (VL)-and thus transmissibility.
Methods: In October 2020, we conducted a prospective trial involving patients presenting at testing centres with symptoms of COVID-19. We compared detection rates and performance of RDT, saliva PCR and nasopharyngeal (NP) PCR, according to VL and symptoms duration.
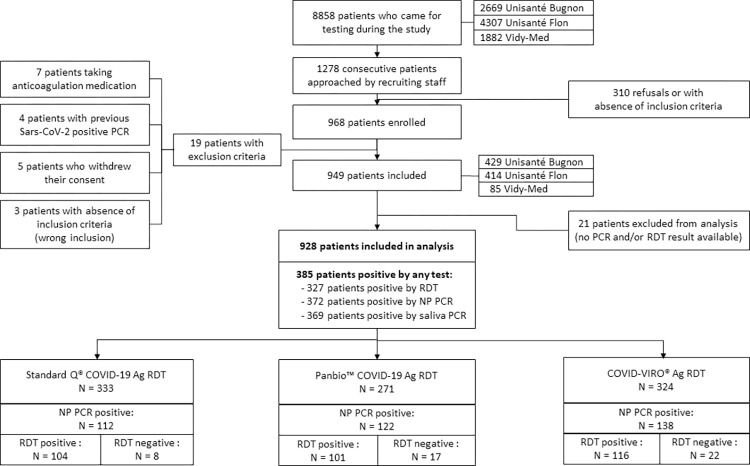
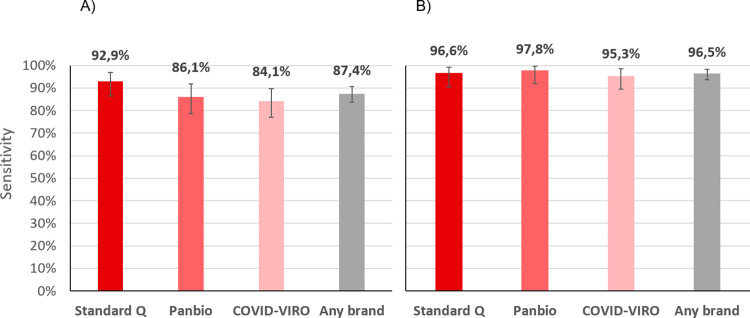
Results: Out of 949 patients enrolled, 928 patients had all three tests performed. Detection rates were 35.2% (95%CI 32.2-38.4%) by RDT, 39.8% (36.6-43.0%) by saliva PCR, 40.1% (36.9-43.3%) by NP PCR, and 41.5% (38.3-44.7%) by any test. For those with viral loads (VL) ≥106 copies/ml, detection rates were 30.3% (27.3-33.3), 31.4% (28.4-34.5), 31.5% (28.5-34.6), and 31.6% (28.6-34.7%) respectively. Sensitivity of RDT compared to NP PCR was 87.4% (83.6-90.6%) for all positive patients, 94.5% (91.5-96.7%) for those with VL≥105 and 96.5% (93.6-98.3%) for those with VL≥106. Sensitivity of STANDARD-Q®, Panbio™ and COVID-VIRO® Ag tests were 92.9% (86.4-96.9%), 86.1% (78.6-91.7%) and 84.1% (76.9-89.7%), respectively. For those with VL≥106, sensitivity was 96.6% (90.5-99.3%), 97.8% (92.1-99.7%) and 95.3% (89.4-98.5%) respectively. No patient with VL<104 was detected by RDT. Specificity of RDT was 100% (99.3-100%) compared to any PCR. RDT sensitivity was similar <4 days (87.8%, 83.5-91.3%) and ≥4 days (85.7%, 75.9-92.6%) after symptoms onset (p = 0.6). Sensitivity of saliva and NP PCR were 95.7% (93.1-97.5%) and 96.5% (94.1-98.1%), respectively, compared to the other PCR.
Conclusions: RDT results allow rapid identification of COVID cases with immediate isolation of most contagious individuals. RDT can thus be a game changer both in ambulatory care and community testing aimed at stopping transmission chains, and even more so in resource-constrained settings thanks to its very low price. When PCR is performed, saliva could replace NP swabbing.
Trial registration: ClinicalTrial.gov Identifier: NCT04613310 (03/11/2020).
Copyright: © 2023 Schwob et al. This is an open access article distributed under the terms of the Creative Commons Attribution License, which permits unrestricted use, distribution, and reproduction in any medium, provided the original author and source are credited.
Conflict of interest statement
The authors have declared that no competing interests exist.
Figures


References
Publication types
MeSH terms
Substances
Associated data
LinkOut - more resources
Full Text Sources
Medical
Miscellaneous
