. 2023 Feb 24;9(8):eade7864.
doi: 10.1126/sciadv.ade7864. Epub 2023 Feb 24.

Mitochondrial phosphatidylethanolamine modulates UCP1 to promote brown adipose thermogenesis

Affiliations

Mitochondrial phosphatidylethanolamine modulates UCP1 to promote brown adipose thermogenesis

Jordan M Johnson et al. Sci Adv. .

Abstract

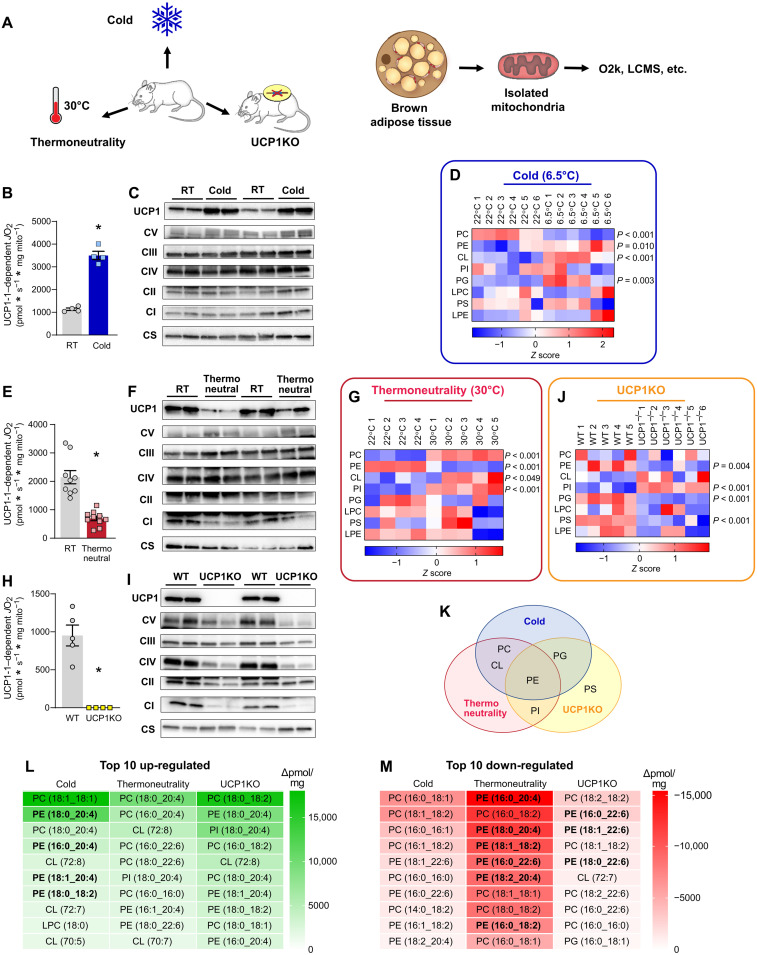
Thermogenesis by uncoupling protein 1 (UCP1) is one of the primary mechanisms by which brown adipose tissue (BAT) increases energy expenditure. UCP1 resides in the inner mitochondrial membrane (IMM), where it dissipates membrane potential independent of adenosine triphosphate (ATP) synthase. Here, we provide evidence that phosphatidylethanolamine (PE) modulates UCP1-dependent proton conductance across the IMM to modulate thermogenesis. Mitochondrial lipidomic analyses revealed PE as a signature molecule whose abundance bidirectionally responds to changes in thermogenic burden. Reduction in mitochondrial PE by deletion of phosphatidylserine decarboxylase (PSD) made mice cold intolerant and insensitive to β3 adrenergic receptor agonist-induced increase in whole-body oxygen consumption. High-resolution respirometry and fluorometry of BAT mitochondria showed that loss of mitochondrial PE specifically lowers UCP1-dependent respiration without compromising electron transfer efficiency or ATP synthesis. These findings were confirmed by a reduction in UCP1 proton current in PE-deficient mitoplasts. Thus, PE performs a previously unknown role as a temperature-responsive rheostat that regulates UCP1-dependent thermogenesis.


Figures

Fig. 1.
Fig. 1.. Brown adipose mitochondrial lipidome is highly responsive to changes in thermogenic burden.
(A) Experimental design to assess the influences of cold, thermoneutrality, or UCP1 knockout on BAT mitochondrial energetics and lipidome. (B) UCP1-dependent respiration stimulated by malate and pyruvate in BAT mitochondria from C57BL/6J mice housed at RT or 6.5°C for 7 days. n = 4 per group. (C) Protein abundance of UCP1, ETS subunits, and citrate synthase in BAT mitochondria isolated from C57BL/6J mice housed at RT or 6.5°C for 7 days. (D) Summary heatmap of changes in BAT mitochondrial phospholipidome in C57BL/6J mice housed at RT or 6.5°C for 7 days. Abundance of lipids in each lipid class was derived from individual lipid species in fig. S1. n = 6 per group. (E) UCP1-dependent respiration in BAT mitochondria from C57BL/6J mice housed at RT or 30°C for 30 days. n = 9 to 10 per group. (F) Protein abundance of UCP1, ETS subunits, and citrate synthase in BAT mitochondria from C57BL/6J mice housed at RT or 30°C for 30 days. (G) Summary heatmap of changes in BAT mitochondrial phospholipidome in C57BL/6J mice housed at RT or 30°C for 30 days. Abundance of lipids in each lipid class was derived from individual lipid species in fig. S2. n = 4 to 5 per group. (H) UCP1-dependent respiration in BAT mitochondria from wild-type (WT) and UCP1KO mice. n = 4 to 5 per group. (I) Protein abundance of UCP1, ETS subunits, and citrate synthase in BAT mitochondria from WT and UCP1KO mice. (J) Summary heatmap of changes in BAT mitochondrial phospholipidome in WT and UCP1KO mice. n = 5 to 6 per group. (K) Venn diagram demonstrating PE as the only class of lipids that is influenced by cold, thermoneutrality, and UCP1 knockout. (L) A list of the top 10 mitochondrial lipid species that are up-regulated with cold, thermoneutrality, or UCP1 knockout. (M) A list of the top 10 mitochondrial lipid species that are down-regulated with cold, thermoneutrality, or UCP1 knockout. Data are presented as ±SEM. *P < 0.05.
Fig. 2.
Fig. 2.. Loss of mitochondrial CL impairs brown adipose thermogenesis.
(A) Schematic for mitochondrial CL biosynthesis. (B) CLS mRNA abundance in BAT from control and CLS-iBKO mice. n = 10 to 12 per group. (C) Abundance of mitochondrial CL species in BAT from control and CLS-iBKO mice. n = 8 to 10 per group. (D) Body mass. n = 8 to 13 per group. (E) Body composition. n = 5 to 7 per group. (F) Representative intrascapular BAT depots from control and CLS-iBKO mice. (G) Hematoxylin and eosin staining. Scale bars, 50 μM. (H) Core body temperature of mice subjected to an acute cold tolerance test at 4°C. n = 7 to 9 per group. (I) Time course of whole-body oxygen consumption in mice before and after injection of CL-316,243. n = 6 to 8 per group. (J) Mean whole-body oxygen consumption following administration of CL-316,243. n = 6 to 8 per group. (K) Spontaneous movement in metabolic cages. n = 8 per group. Data are presented as ±SEM. *P < 0.05.
Fig. 3.
Fig. 3.. CL deficiency does not impair capacity for uncoupled respiration.
(A) Transmission electron microscopy images of BAT mitochondria from control and CLS-iBKO mice. Scale bars, 2 μM. (B) mtDNA levels normalized to nucDNA in BAT from control and CLS-iBKO mice. n = 9 to 13 per group. (C) Protein abundance of UCP1, ETS subunits, and CS in whole BAT homogenates. (D) CS activity in whole BAT homogenates. n = 4 to 5 per group. (E) Mitochondrial O2 consumption (JO2) in BAT mitochondria from control and CLS-iBKO mice, measured in the presence of 5 mM pyruvate, 0.2 mM malate, 5 mM glutamate, 5 mM succinate, and 2, 20, and 200 μM ADP. n = 5 to 6 per group. (F) ATP production (JATP) in the presence of 5 mM pyruvate, 0.2 mM malate, 5 mM glutamate, 5 mM succinate, and 2, 20, and 200 μM ADP. n = 5 to 6 per group. (G) Mitochondrial coupling efficiency (ATP/O ratio). n = 5 to 6 per group. (H) UCP1-dependent respiration in BAT mitochondria from control and CLS-iBKO mice. Respiration was stimulated by 5 mM pyruvate and 0.2 mM malate, and UCP1 was subsequently inhibited by 4 mM guanosine diphosphate (GDP). n = 8 to 12 per group. (I) Protein abundance of UCP1, ETS subunits, and CS in isolated mitochondria. (J) UCP1-dependent respiration stimulated by 0.2 mM malate, 5 mM carnitine, and 20 μM palmitoyl-CoA. n = 6 per group. (K) UCP1-dependent respiration stimulated by 0.2 mM malate, 5 mM carnitine, and 20 μM palmitoyl-l-carnitine. n = 3 to 5 per group. (L) Abundance of phosphorylated (Ser563 and Ser660) and total hormone-sensitive lipase (HSL), adipose triglyceride lipase (ATGL), acetyl-CoA carboxylase (ACC), fatty acid synthase (FAS), and diacylglycerol acyltransferase 1 and 2 (DGAT1 and DGAT2) in whole BAT homogenates. (M) Abundance of ryanodine receptor 2 (RyR2), sarco/endoplasmic reticulum Ca2+–adenosine triphosphatase 2 (SERCA2), tissue nonspecific alkaline phosphatase (TNAP), creatine kinase B (CKB), creatine kinase, mitochondrial 2 (CKMT2), and ADP/ATP carrier 1 and 2 (AAC1 and AAC2) in whole BAT homogenates. Data are presented as ±SEM. *P < 0.05.
Fig. 4.
Fig. 4.. Loss of mitochondrial PE impairs brown adipose thermogenesis.
(A) Schematic for mitochondrial PE biosynthesis. (B) PSD mRNA abundance in BAT from control and PSD-iBKO mice. n = 7 to 13 per group. (C) Representative images of PSD Western blot in BAT from control and PSD-iBKO mice. (D) Mitochondrial PE species abundance in BAT 2 weeks after tamoxifen injection. n = 5 per group. (E) Body mass. n = 15 to 17 per group. (F) Body composition. n = 4 per group. (G) Representative intrascapular BAT depots from control and PSD-iBKO mice. (H) Masson’s trichrome blue staining of BAT. Scale bars, 50 μM. (I) Core body temperature of mice subjected to an acute cold tolerance test at 4°C. n = 7 to 8 per group. (J) Time course of whole-body oxygen consumption in mice before and after injection of CL-316,243. n = 5 per group. (K) Mean whole-body oxygen consumption following administration of CL-316,243. n = 5 per group. (L) Spontaneous movement in metabolic cages. n = 3 to 5 per group. Data are presented as ±SEM. *P < 0.05.
Fig. 5.
Fig. 5.. Mitochondrial PE is essential for UCP1-dependent respiration.
(A) Transmission electron microscopy images of BAT mitochondria from control and PSD-iBKO mice. Scale bars, 2 μM. (B) mtDNA levels normalized to nucDNA in BAT from control and PSD-iBKO mice. n = 7 to 8 per group. (C) Protein abundance of UCP1, ETS subunits, and CS in whole BAT homogenates. (D) Abundance of phosphorylated (Ser660) and total HSL, ATGL, DGAT1, and DGAT2 in whole BAT homogenates. (E) Mitochondrial O2 consumption in BAT mitochondria from control and PSD-iBKO mice, measured in the presence of 5 mM pyruvate, 0.2 mM malate, 5 mM glutamate, 5 mM succinate, and 2, 20, and 200 μM ADP. n = 8 to 9 per group. (F) ATP production in the presence of 5 mM pyruvate, 0.2 mM malate, 5 mM glutamate, 5 mM succinate, and 2, 20, and 200 μM ADP. n = 6 to 7 per group. (G) Mitochondrial coupling efficiency (ATP/O ratio). n = 6 to 7 per group. (H) UCP1-dependent respiration in BAT mitochondria from control and PSD-iBKO mice. Respiration was stimulated by 5 mM pyruvate and 0.2 mM malate, and UCP1 was subsequently inhibited by 4 mM GDP. n = 8 to 9 per group. (I) Protein abundance of UCP1, AAC1, AAC2, CS, and ETS subunits in isolated mitochondria. Data are presented as ±SEM. *P < 0.05.
Fig. 6.
Fig. 6.. Mitochondrial PE is essential for proton current through UCP1.
(A) Differential interference contrast image of BAT mitoplasts reveals typical bilobed appearance. IMM, black arrowhead; OMM remnant, white arrowhead. Scale bar, 2 μM. (B) Schematic illustrating electrophysiological recording setup for proton (H+) current. (C) Top: Voltage ramp protocol. Bottom: Exemplar traces showing baseline proton currents (red) and after the addition of 1 mM ATP (black). Measurements are taken at −160 mV (arrowheads). (D) Exemplar time course of proton current inhibition with ATP. (E) Summary of proton current densities (n = 15 to 19 mitoplasts per group). (F) Quantification of UCP1 current density, taken as the difference for each mitoplast between baseline and after ATP addition divided by total current density, from (E) (n = 15 to 19 mitoplasts per group). Data are presented as ±SEM.

References

    1. Hales C. M., Carroll M. D., Fryar C. D., Ogden C. L., Prevalence of prescription pain medication use among adults: United States, 2015–2018. NCHS Data Brief , 1–8 (2020). - PubMed
    1. Schelbert K. B., Comorbidities of obesity. Prim. Care 36, 271–285 (2009). - PubMed
    1. Kopecký J., Hodný Z., Rossmeisl M., Syrový I., Kozak L. P., Reduction of dietary obesity in aP2-Ucp transgenic mice: Physiology and adipose tissue distribution. Am. J. Physiol. 270, E768–E775 (1996). - PubMed
    1. Heden T. D., Johnson J. M., Ferrara P. J., Eshima H., Verkerke A. R. P., Wentzler E. J., Siripoksup P., Narowski T. M., Coleman C. B., Lin C.-T., Ryan T. E., Reidy P. T., de Castro Brás L. E., Karner C. M., Burant C. F., Maschek J. A., Cox J. E., Mashek D. G., Kardon G., Boudina S., Zeczycki T. N., Rutter J., Shaikh S. R., Vance J. E., Drummond M. J., Neufer P. D., Funai K., Mitochondrial PE potentiates respiratory enzymes to amplify skeletal muscle aerobic capacity. Sci. Adv. 5, eaax8352 (2019). - PMC - PubMed
    1. Cogliati S., Enriquez J. A., Scorrano L., Mitochondrial cristae: Where beauty meets functionality. Trends Biochem. Sci. 41, 261–273 (2016). - PubMed