. 2023 Feb 24;8(80):eadd4132.
doi: 10.1126/sciimmunol.add4132. Epub 2023 Feb 24.

pDC-like cells are pre-DC2 and require KLF4 to control homeostatic CD4 T cells

Affiliations

pDC-like cells are pre-DC2 and require KLF4 to control homeostatic CD4 T cells

Patrick Fernandes Rodrigues et al. Sci Immunol. .

Abstract

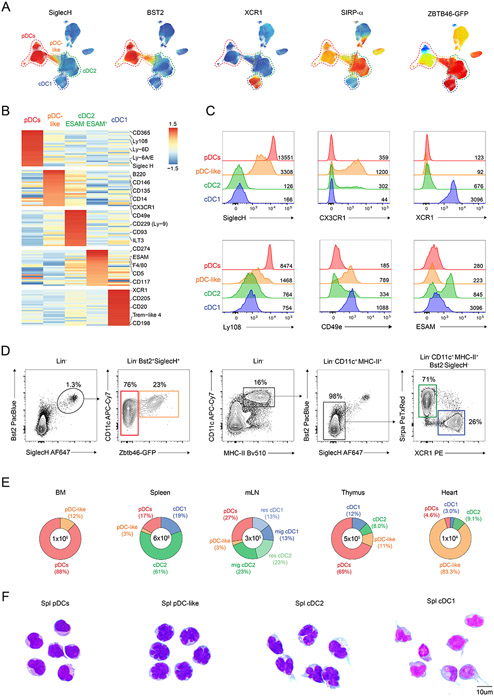
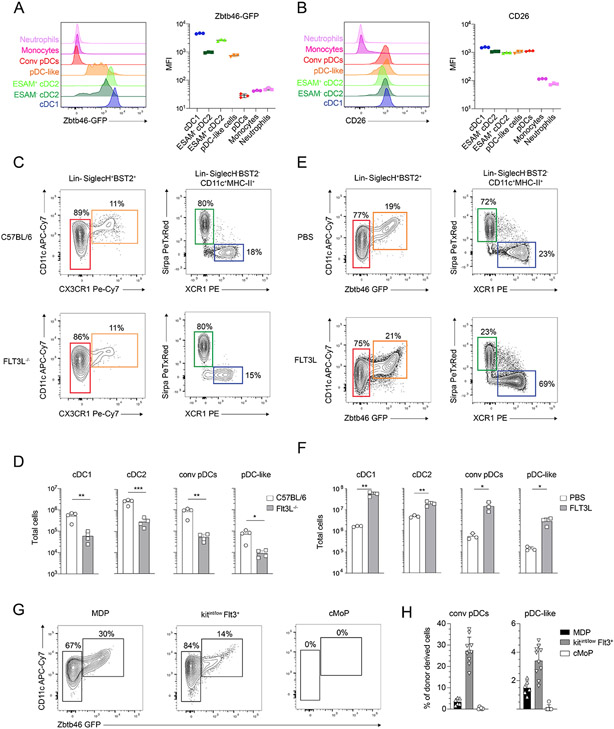
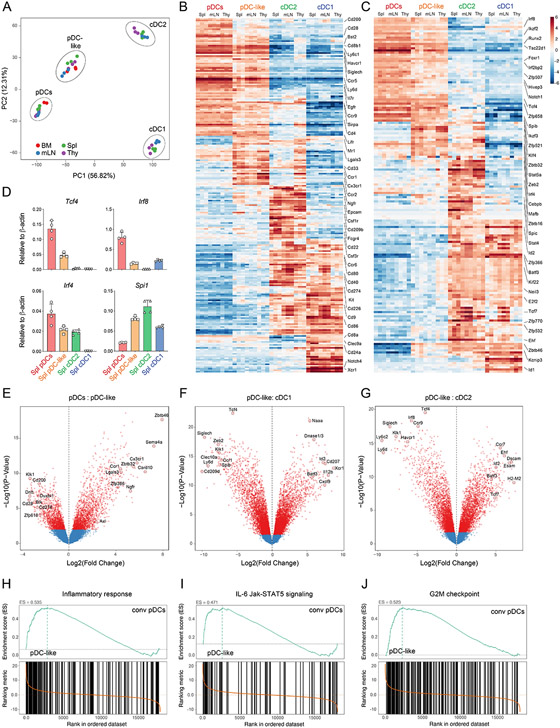
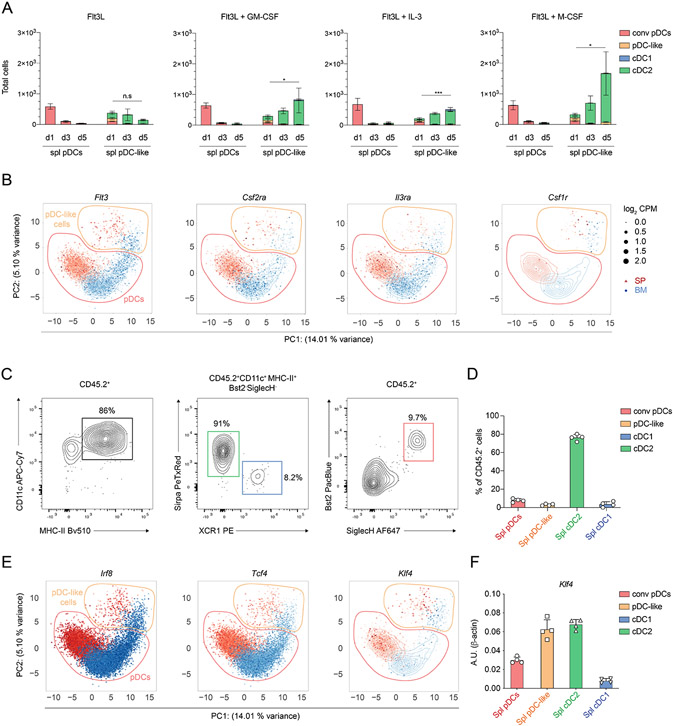
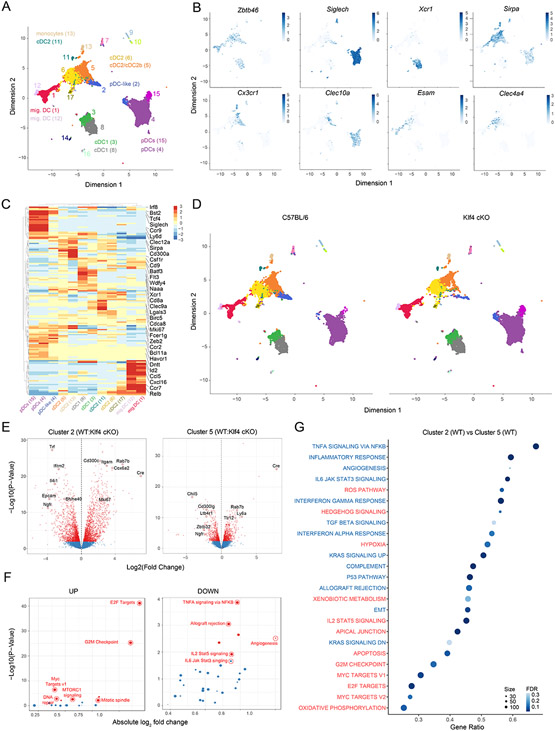
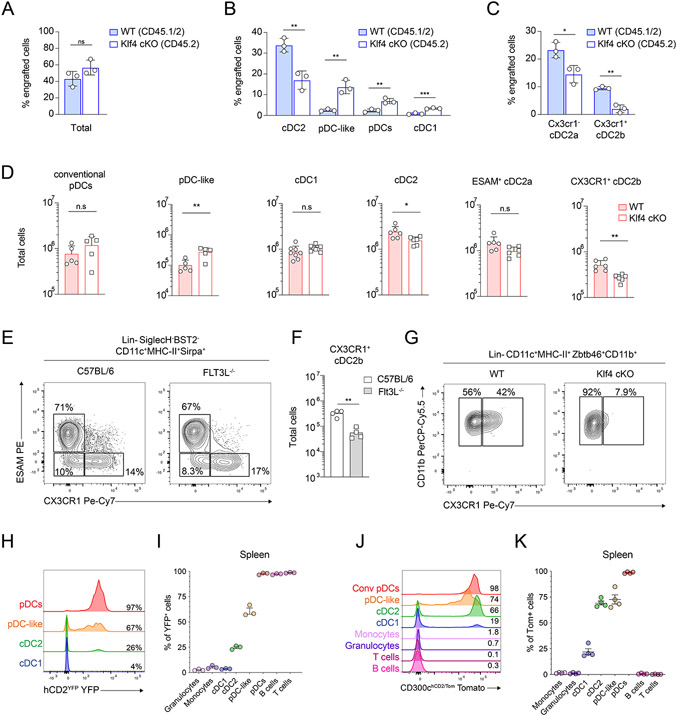
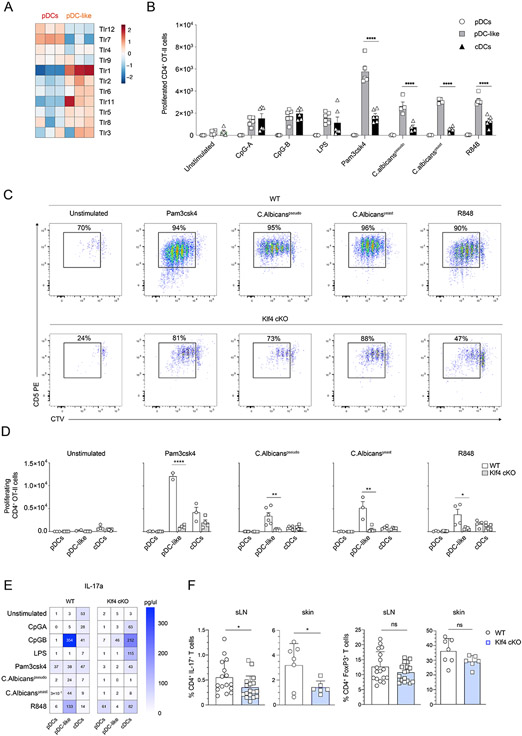
Plasmacytoid dendritic cells (pDCs) have been shown to play an important role during immune responses, ranging from initial viral control through the production of type I interferons to antigen presentation. However, recent studies uncovered unexpected heterogeneity among pDCs. We identified a previously uncharacterized immune subset, referred to as pDC-like cells, that not only resembles pDCs but also shares conventional DC (cDC) features. We show that this subset is a circulating precursor distinct from common DC progenitors, with prominent cDC2 potential. Our findings from human CD2-iCre and CD300c-iCre lineage tracing mouse models suggest that a substantial fraction of cDC2s originates from pDC-like cells, which can therefore be referred to as pre-DC2. This precursor subset responds to homeostatic cytokines, such as macrophage colony stimulating factor, by expanding and differentiating into cDC2 that efficiently prime T helper 17 (TH17) cells. Development of pre-DC2 into CX3CR1+ ESAM- cDC2b but not CX3CR1- ESAM+ cDC2a requires the transcription factor KLF4. Last, we show that, under homeostatic conditions, this developmental pathway regulates the immune threshold at barrier sites by controlling the pool of TH17 cells within skin-draining lymph nodes.


Figures

Figure 1.
Figure 1.. pDC-like cells are highly abundant in the heart and at epithelial sites.
(A-B) Splenocytes from three Zbtb46GFP/WT mice were enriched for CD11c and stained with 9 backbone markers followed by the individual 255 PE-conjugated markers provided by the LEGENDscreen kit as explained in the methods. (A) A non-linear dimensionality reduction was performed on the backbone markers and projected on a UMAP space. Shown is the relative expression for the indicated marker across the UMAP. (B) Shown is an expression heatmap obtained for the top 25 differentially expressed markers on the clustered DC subsets obtained as explained in the methods. (C) Shown are single-color histograms for the indicated markers expressed by pDCs (red), pDC-like cells (orange), cDC2 (green) and cDC1 (blue). (D) Gating strategy for splenic pDCs (red), pDC-like cells (orange), cDC2 (green) and cDC1 (blue) (n=6 mice). (E) Shown are the total cell number and percent distribution of all DC subsets across the indicated lymphoid and non-lymphoid tissues (n=3 mice, two independent experiments). (F) May–Grünwald staining was performed on cytospins of sort-purified splenic pDCs, pDC-like, cDC2 and cDC1 (n = 3 representative images taken from 2 independent experiments: scale bars, 10 μm).
Figure 2.
Figure 2.. pDC-like cells are bona fide dendritic cells
(A-B) Shown are single-color histograms and the mean fluorescent intensity (MFI) for Zbtb46-GFP (A) or CD26 (B) expression across the indicated leukocytes. (C-D) C57BL/6 and Flt3L−/− mice were analyzed for splenic cDC subsets, pDC and pDC-like cells. Cells were gated as shown in (C). Total cells gated as in (C) are shown in (D). (E-F) Zbtb46GFP/WT mice were injected with PBS or FLT3L as explained in methods. Shown is the frequency (E) and number (F) of splenic cDC subsets, pDC and pDC-like cells gated as shown in (E) (n=3-4 mice, two or three independent experiments, each dot represents a sample, and thin lines represent the mean ± s.d.). (G-H) MDPs (black bars), cKITint/lowFLT3+DC precursors (gray bars) and cMoPs (white bars), gated as defined in methods isolated from Zbtb46-GFP mice were adoptively transferred into sub-lethally irradiated congenic mice. Mice were analyzed for donor derived cells four days after injection. Shown are two color plots (G) or percent donor derived (H) pDC (CD11clowGFP) and pDC-like cells (CD11c+GFP+), pre-gated as 7-AADLinSiglecH+Bst2+. (n=6-8 mice, two or three independent experiments, each dot represents a sample, and thin lines represent the mean ± s.d.). Statistical analysis was done with unpaired two-tailed t-test. *P < 0.05, **P < 0.01, ***P < 0.001, ****P < 0.0001.
Figure 3.
Figure 3.. pDC-like cells are transcriptionally similar to pDCs.
(A-J) Bulk RNA Sequencing was performed on sort purified pDCs, pDC-like cells, cDC2 and cDC1 isolated from the BM (red), Spleen (green), Thymus (purple) and mLN (blue). RNA was isolate on three consecutive days using each time cells obtained from a single mouse (A) Principal Component Analysis (PCA) on the DC subsets calculated as explained in methods. (B-C) Shown are heatmaps with relative expression values, centered and normalized on the mean for the most differentially expressed cell-surface genes (B) or transcription factors (C) (log2FC >2.0) on the indicated subsets and tissues. (D) qRT-PCR on the indicated genes for the indicated subsets (n=4 mice, two independent experiments, shown are mean values +/−s.d.). (E-G) Volcano plots showing pair-wise comparisons as Log2FC expression on transcripts for pDCs versus pDC-like cells (E), pDC-like cells versus cDC1 (F) and pDC-like cells vs cDC2 pooled across all tissues (G). (H-J) Gene set enrichment analysis, performed on the Molecular Signature Database (MSigDb v5.2) showing the enrichment score (ES) for splenic pDC-like cells versus splenic pDCs, as depicted.
Figure 4.
Figure 4.. pDC-like cells respond to homeostatic cytokines and differentiate into cDC2
(A) Sort purified splenic pDCs and pDC-like cells isolated from C57BL/6 mice were cultured for four days in the presence of FLT3L alone (left panel) or FLT3L in combination with GM-CSF, IL-3 or M-CSF as indicated. cDC1 (blue), cDC2 (green), pDCs (red) and pDC-like cells (orange) were determined at the indicated timepoints. (B) Shown is the UMAP projection depicting the expression levels for the indicated genes obtained from scRNA seq data previously generated on sort purified BM and splenic Bst2+ SiglecH+ cells. BM (blue) and splenic (red) pDC and pDC-like cells were determined based on clustering analysis and are shown by the dotted contour lines. The size of each dot corresponds to the relative expression of a given gene for each cell. The contour lines indicate the density of the BM (blue) and splenic (red) cells in the PCA space calculated as previously described . (C and D) Sort purified pDC-like cells isolated from Zbtb46-GFP mice were transferred into sub-lethally irradiated congenic mice. Donor cells were analyzed 4 days after transfer based on the expression of DC markers. The relative contribution was determined (D) for donor derived cells gated as in (C). (E) scRNA-seq expression of the indicated TFs as in (B). (F) qRT-PCR for the expression of Klf4 on sort purified splenic pDCs (red), pDC-like (orange), cDC2 (green), and cDC1 (blue) (n=4 mice, two independent experiments, shown are mean values +/−s.d.).
Figure 5.
Figure 5.. Selective Klf4 deficiency profoundly alters pDC-like signature
(A-G) scRNA-seq on CD11c+ enriched and sort-purified DCs isolated from spleens, sLN and mLN derived from C57BL/6 (WT) or Klf4fl/flCD11cCre+ (Klf4-cKO) mice performed and analyzed as explained in methods. (A) Shown are all cells colored based on cluster distribution and projected on a UMAP 2D-space. (B) Shown are UMAP plots depicting the expression for the indicated genes obtained for WT cells. (C) Shown is a relative expression heatmap of the top 50 DEGs across all clusters. (D) Shown are UMAP plots depicting cells obtained from WT or Klf4-cKO mice as indicated. (E) Volcano plots showing pair-wise comparisons between WT and Klf4-cKO cells from cluster 2 (left) or cluster 5 (right). (F) GSEA performed on the Molecular Signature Database (MSigDb v5.2) comparing the enrichment score (ES) obtained for WT and Klf4-cKO cells from cluster 2. Pathways were plotted based on up (left) or down-regulation in Klf4-cKO versus WT cells (right). (G) GSEA dot plot analysis showing the most enriched pathways between cluster 2 and 5 for cells obtained from WT mice. Pathways are colored based on their down (blue) or up-regulation (red) in cluster 2 (FDR= false discovery rate).
Figure 6.
Figure 6.. pDC-like cells require KLF4 for cDC2 development.
(A-C) pDC-like cells isolated from Cd45.1/.2Zbtb46GFP/WT (WT) and Cd45.2Zbtb46GFP/WT Klf4-cKO were co-transferred into sub-lethally irradiated recipient Cd45. recipient mice. Shown are percentages of total donor-derived cells (A) or percentage donor-derived cDC2, pDC-like, pDCs and cDC1 cells (B), or CX3CR1 cDC2a and CX3CR1+ cDC2b cells (C). (n=3 mice, three independent experiments, each dot represents a sample, and thin lines represent the mean ± s.d.). (D) Shown are total cells present in Klf4fl/flCD11ccre− (WT) or Klf4fl/flCD11cCre+ (Klf4-cKO) mice. Each subset is gated as shown in Fig 1D and fig. S2A. (n=6 mice, three independent experiments, each dot represents a sample, and thin lines represent the mean ± s.d.). (E) Shown is the expression of CX3CR1 and ESAM on splenic cDC2 pre-gated as 7-AADLinSiglecHBst2CD11c+MHC-II+ obtained from C57BL/6 or Flt3L−/− mice. (F) Total cell number of splenic cDC2b obtained from C57BL/6 and Flt3L−/− mice. (G) Sort purified splenic pDC-like cells obtained from Zbtb46GFP/WTKlf4fl/flCre or Zbtb46GFP/WTKlf4-cKO mice were cultured for four days in presence of FLT3L. Shown is the expression of CX3CR1 on cDC2 pre-gated as 7-AADLinSiglecHBst2CD11c+MHC-II+GFP+CD11b+. (H-I) The expression of YFP as single-color histograms (H) or cumulative bar graph (I) is shown for the indicated subsets on splenocytes isolated from hCD2YFP mice. (J-K) Splenocytes isolated from CD300chCD2/Tom mice were analyzed for the expression of Tomato. Shown are single-color histograms (J) and cumulative bar graphs (K) of Tomato positive cells across the indicated immune cell subsets gated as shown in Fig. 1D or as CD19+B220+B cells, CD3+ T cells, Ly6ChiCD11b+ monocytes and Ly6CintCD11b+ granulocytes. Statistical analysis was done with unpaired two-tailed t-test. *P < 0.05, **P < 0.01, ***P < 0.001, ****P < 0.0001.
Figure 7.
Figure 7.. KLF4-dependent cDC2 regulate homeostatic Th17 and Tregs in the skin.
(A) Relative expression heat map on pDCs and pDC-like cells sorted and analyzed as in Fig.3A for the indicated TLRs. (B) OT-II T cells were co-cultured in the presence of activate cDCs, pDCs or pDC-like cells isolated from Zbtb46GFP/WT (WT) mice as indicated. Shown are total cell numbers of proliferating OT-II T cells gated as CD4+TCRβ+CD5+CTVint/neg at day 4. (n=4-6 mice, two independent experiments, each dot represents a sample, and thin lines represent the mean ± s.d.). (C-D) OT-II T cells were co-cultured in the presence of activated cDCs, pDCs or pDC-like cells isolated from Zbtb46GFP/WT (WT), or Klf4fl/flCD11cCre+Zbtb46GFP/WT (Klf4-cKO) as indicated. (C) Shown are representative flow cytometry plots showing the expression of CD5 and CTV on OT-II T cells. (D) Shown are total cell numbers of proliferating OT-II T cells gated as CD4+TCRβ+CD5+CTVint/neg. (E) CD4+ T cells obtained from DBA/2 mice were co-cultured in the presence of activated cDCs, pDCs or pDC-like cells isolated from Zbtb46GFP/WT (WT) or Klf4fl/flCD11cCre+Zbtb46GFP/WT (Klf4-cKO) mice, as indicated. The concentration of IL-17a was measured in the supernatant using the BioLegend T Helper cytometric bead array panel according to the manufacturer’s instructions (n=3 mice, three independent experiments). (F) Ex-vivo isolated cells from the skin or the sLNs obtained from Klf4fl/flCD11cCre−Zbtb46GFP/WT (WT) or Klf4fl/flCD11cCre+Zbtb46GFP/WT (Klf4-cKO), as indicated, were stimulated with PMA, ionomycin and brefeldin A and analyzed for the percent CD4+IL-17+ T cells (left) or CD4+Foxp3+Tregs (right). Statistical analysis was done with unpaired two-tailed t-test. *P < 0.05, **P < 0.01, ***P < 0.001, ****P < 0.0001.

References

    1. Cabeza-Cabrerizo M, Cardoso A, Minutti CM, Pereira da Costa M & Reis e Sousa C Dendritic Cells Revisited. Annu Rev Immunol 39, 131–166 (2021). - PubMed
    1. Eisenbarth SC Dendritic cell subsets in T cell programming: location dictates function. Nat Rev Immunol 19, 89–103 (2019). - PMC - PubMed
    1. Shortman K & Liu YJ Mouse and human dendritic cell subtypes. Nat.Rev.Immunol 2, 151–161 (2002). - PubMed
    1. Banchereau J et al. Immunobiology of dendritic cells [Review]. Annual Review of Immunology 18, 767–811 (2000). - PubMed
    1. Guilliams M et al. Dendritic cells, monocytes and macrophages: a unified nomenclature based on ontogeny. Nat.Rev.Immunol 14, 571–578 (2014). - PMC - PubMed

Publication types