. 2023 Feb 24;18(2):e0282332.
doi: 10.1371/journal.pone.0282332. eCollection 2023.

Droplet digital PCR-based testing for donor-derived cell-free DNA in transplanted patients as noninvasive marker of allograft health: Methodological aspects

Affiliations

Droplet digital PCR-based testing for donor-derived cell-free DNA in transplanted patients as noninvasive marker of allograft health: Methodological aspects

Frederik Banch Clausen et al. PLoS One. .

Abstract

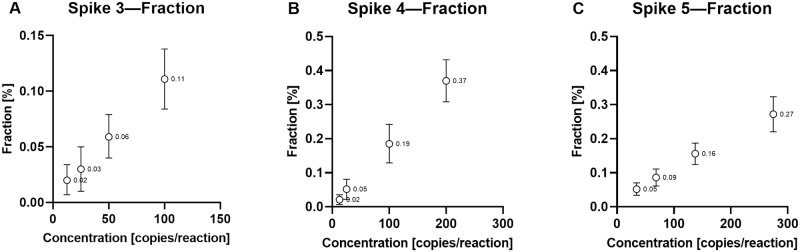
In solid organ transplantation, donor-derived cell-free DNA (dd-cfDNA) is a promising universal noninvasive biomarker for allograft health, where high levels of dd-cfDNA indicate organ damage. Using Droplet Digital PCR (ddPCR), we aimed to develop an assay setup for monitoring organ health. We aimed to identify the least distinguishable percentage-point increase in the fraction of minute amounts of cfDNA in a large cfDNA background by using assays targeting single nucleotide polymorphisms (SNPs). We mimicked a clinical sample from a recipient in a number of spike-in experiments, where cfDNA from healthy volunteers were mixed. A total of 40 assays were tested and approved by qPCR and ddPCR. Limit of detection (LOD) was demonstrated to be approximately 3 copies per reaction, observed at a fraction of 0.002%, and which would equal 6 copies per mL plasma. Limit of quantification (LOQ) was 35 copies per reaction, estimated to 0.038%. The lowest detectable increase in percentage point of dd-cfDNA was approximately 0.04%. Our results demonstrated that ddPCR has great sensitivity, high precision, and exceptional ability to quantify low levels of cfDNA. The ability to distinguish small differences in mimicking dd-cfDNA was far beyond the desired capability. While these methodological data are promising, further prospective studies are needed to determine the clinical utility of the proposed method.


Conflict of interest statement

The authors have declared that no competing interests exist.

Figures

Fig 1
Fig 1. Linearity.
(A) Showing measured absolute values for DNA concentrations ranging from 0.15 to 400 copies/μL (n = 13). (B) Showing measured fraction for the same values (n = 13). Lines represent identical values. For best view of data points, data are shown on log10 scales. Correlation between measured and expected absolute values: Pearson’s r = 0.997 (95%CI = 0.989–0.999). Correlation between measured and expected fractions: Pearson’s r = 0.996 (95%CI = 0.986–0.999).
Fig 2
Fig 2. Measurement of 0.5% cfDNA.
Measurements shown of 0.5% mimicking dd-cfDNA, as constituted by different absolute values of 100, 200, and 300 copies per reaction spiked into backgrounds of 20,000; 30,000; and 60,000 copies per reaction, respectively. Spike 1 represents experiments with probe A, and Spike 2 represents experiments with probe B. Measurements shown as mean fractions. Error bars represent the 95% confidence interval. Dashed line represents 0.5%.
Fig 3
Fig 3. Linearity of Spike 3–5.
Expected concentration as a function of the measured concentration, both measured in copies/reaction, of three individual experiments, Spike 3–5 (A–C). The diagonal line indicates equal concentrations of expected and measured mimicking dd-cfDNA concentrations. Each dot represents a measured cfDNA concentration. Pearson’s r = 0.9987 (95%CI = 0.938–1) for Spike 3, r = 0.9998 (95%CI = 0.990–1) for Spike 4, and r = 0.9998 (95%CI = 0.992–1) for Spike 5.
Fig 4
Fig 4. Estimation of LOQ.
Non-linear curve fitting of data points from Table 2 from Spike 3–5. Goodness of fit R2 = 0.935; fit indicated by line and 95% confidence interval indicated by dotted lines. According to curve equation, a CV<25% was reached at 35 copies per reaction, indicated on the figure by dashed lines.
Fig 5
Fig 5. Estimation of minimal detectable percentage point for Spike 3–5.
Three independent experiments, Spike 3–5 (A–C). The x-axis of each plot shows the expected cfDNA concentration of the mimicking dd-cfDNA in copies/reaction, while the y-axis shows the calculated fraction of the mimicking dd-cfDNA in percentage. Each dot represents the mean value of the fraction for a measured concentration (data value labeled), while the error bars represent the 95% confidence interval of the mean fraction. Minimal detectable percentage points were estimated between non-overlapping confidence intervals (Spike 1: 0.06%–0.02% = 0.04%; Spike 2: 0.19%–0.05% = 0.14%; Spike 3: 0.16%–0.09% = 0.07%).
Fig 6
Fig 6. Percentage increase compared to LOD and LOQ.
Theoretically estimated minimal copy numbers required to detect a certain percentage increase of dd-cfDNA fraction (50%, 100% and 150%), compared to LOD and LOQ (represented by dashed lines).

References

    1. Gielis EM, Ledeganck KJ, De Winter BY, et al.. Cell-Free DNA: An Upcoming Biomarker in Transplantation. Am J Transplant. 2015;15:2541–51. doi: 10.1111/ajt.13387 - DOI - PubMed
    1. Snyder T, Khush K, Valantine H, Quake S. Universal noninvasive detection of solid organ transplant rejection. Proceedings of the National Academy of Sciences. 2011;108:6229–34. doi: 10.1073/pnas.1013924108 - DOI - PMC - PubMed
    1. Knight SR, Thorne A, Lo Faro ML. Donor-specific Cell-free DNA as a Biomarker in Solid Organ Transplantation. A Systematic Review. Transplantation. 2019;103:273–83. doi: 10.1097/TP.0000000000002482 - DOI - PubMed
    1. Eikmans M, Gielis EM, Ledeganck KJ, Yang J, Abramowicz D, Claas FFJ. Non-invasive Biomarkers of Acute Rejection in Kidney Transplantation: Novel Targets and Strategies. Front Med (Lausanne). 2019;5:358. doi: 10.3389/fmed.2018.00358 - DOI - PMC - PubMed
    1. Bu L, Gupta G, Pai A, et al.. Clinical outcomes from the Assessing Donor-derived cell-free DNA Monitoring Insights of kidney Allografts with Longitudinal surveillance (ADMIRAL) study. Kidney Int. 2022;101:793–803. doi: 10.1016/j.kint.2021.11.034 - DOI - PubMed

Publication types

Substances