. 2023 Apr 11;56(4):783-796.e7.
doi: 10.1016/j.immuni.2023.01.024. Epub 2023 Feb 23.

Monocytes re-enter the bone marrow during fasting and alter the host response to infection

Affiliations

Monocytes re-enter the bone marrow during fasting and alter the host response to infection

Henrike Janssen et al. Immunity. .

Abstract

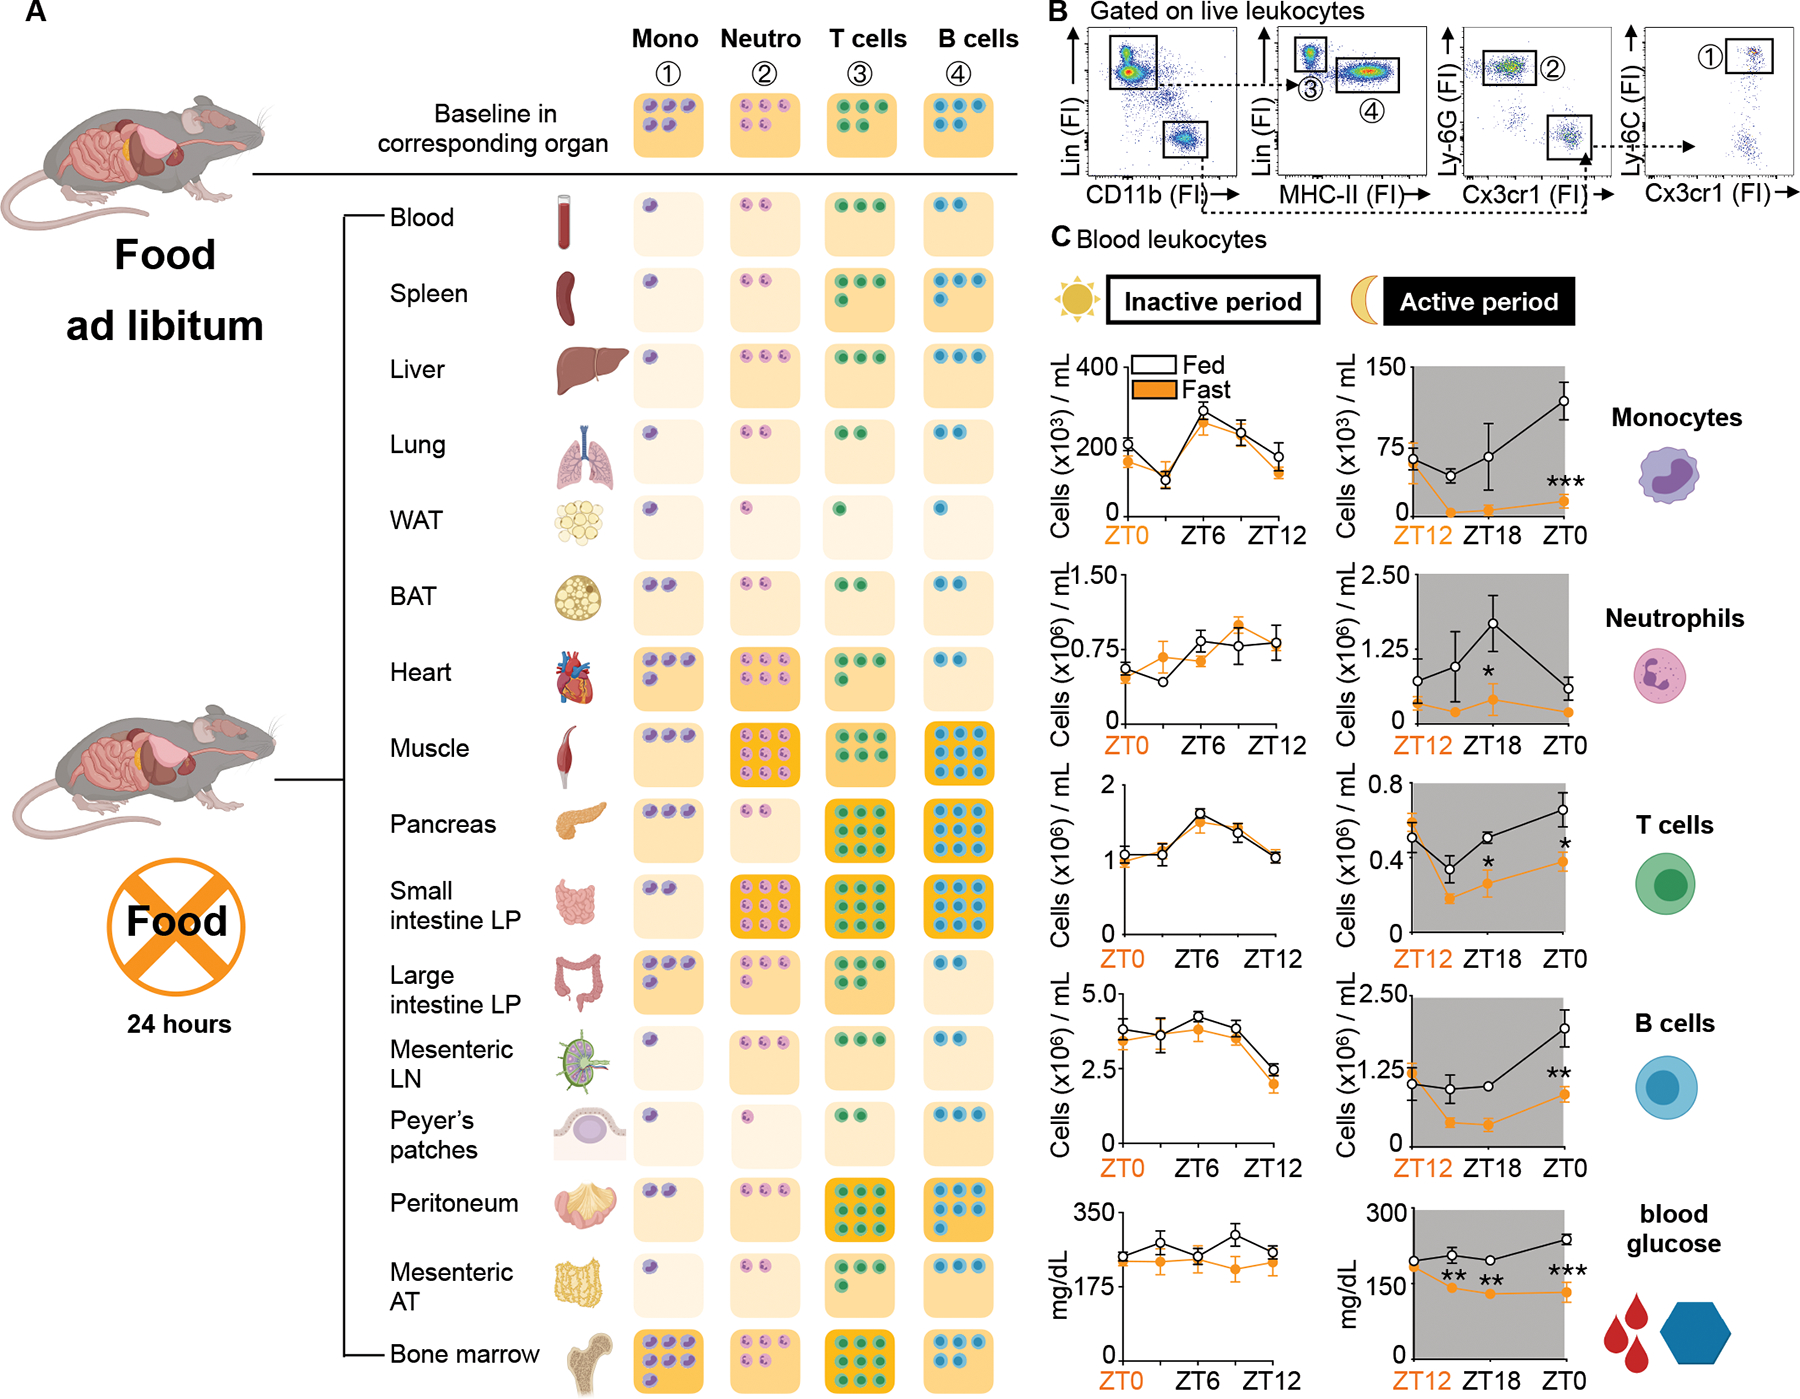
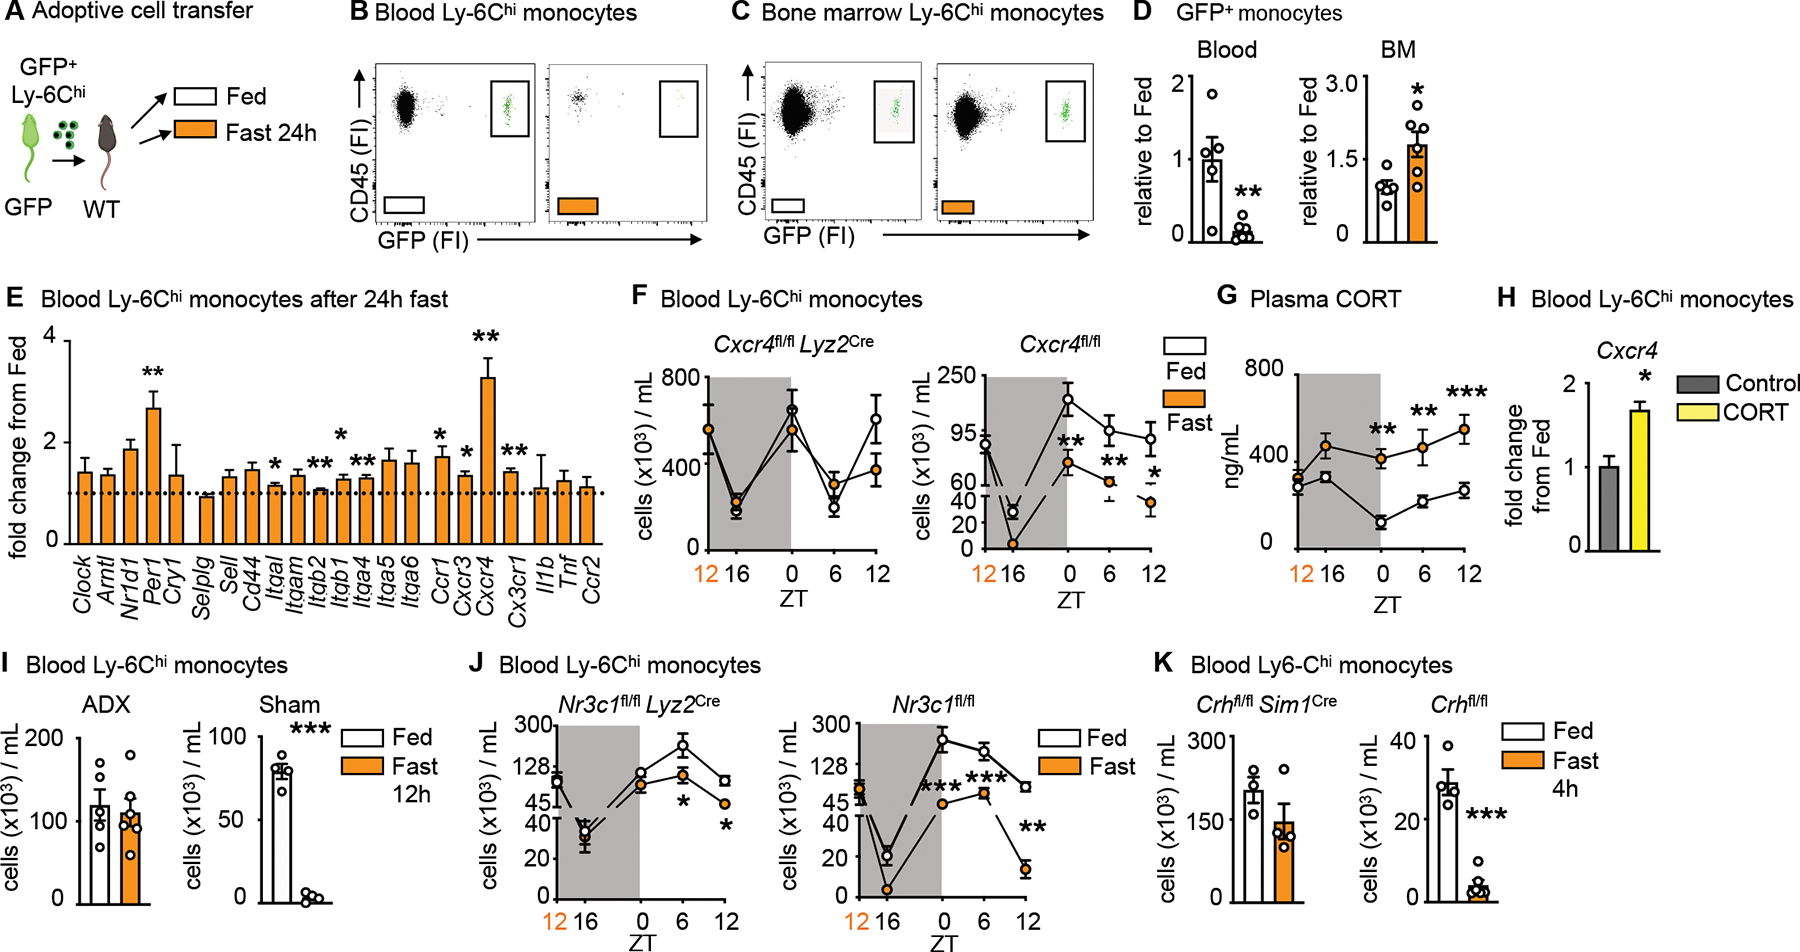
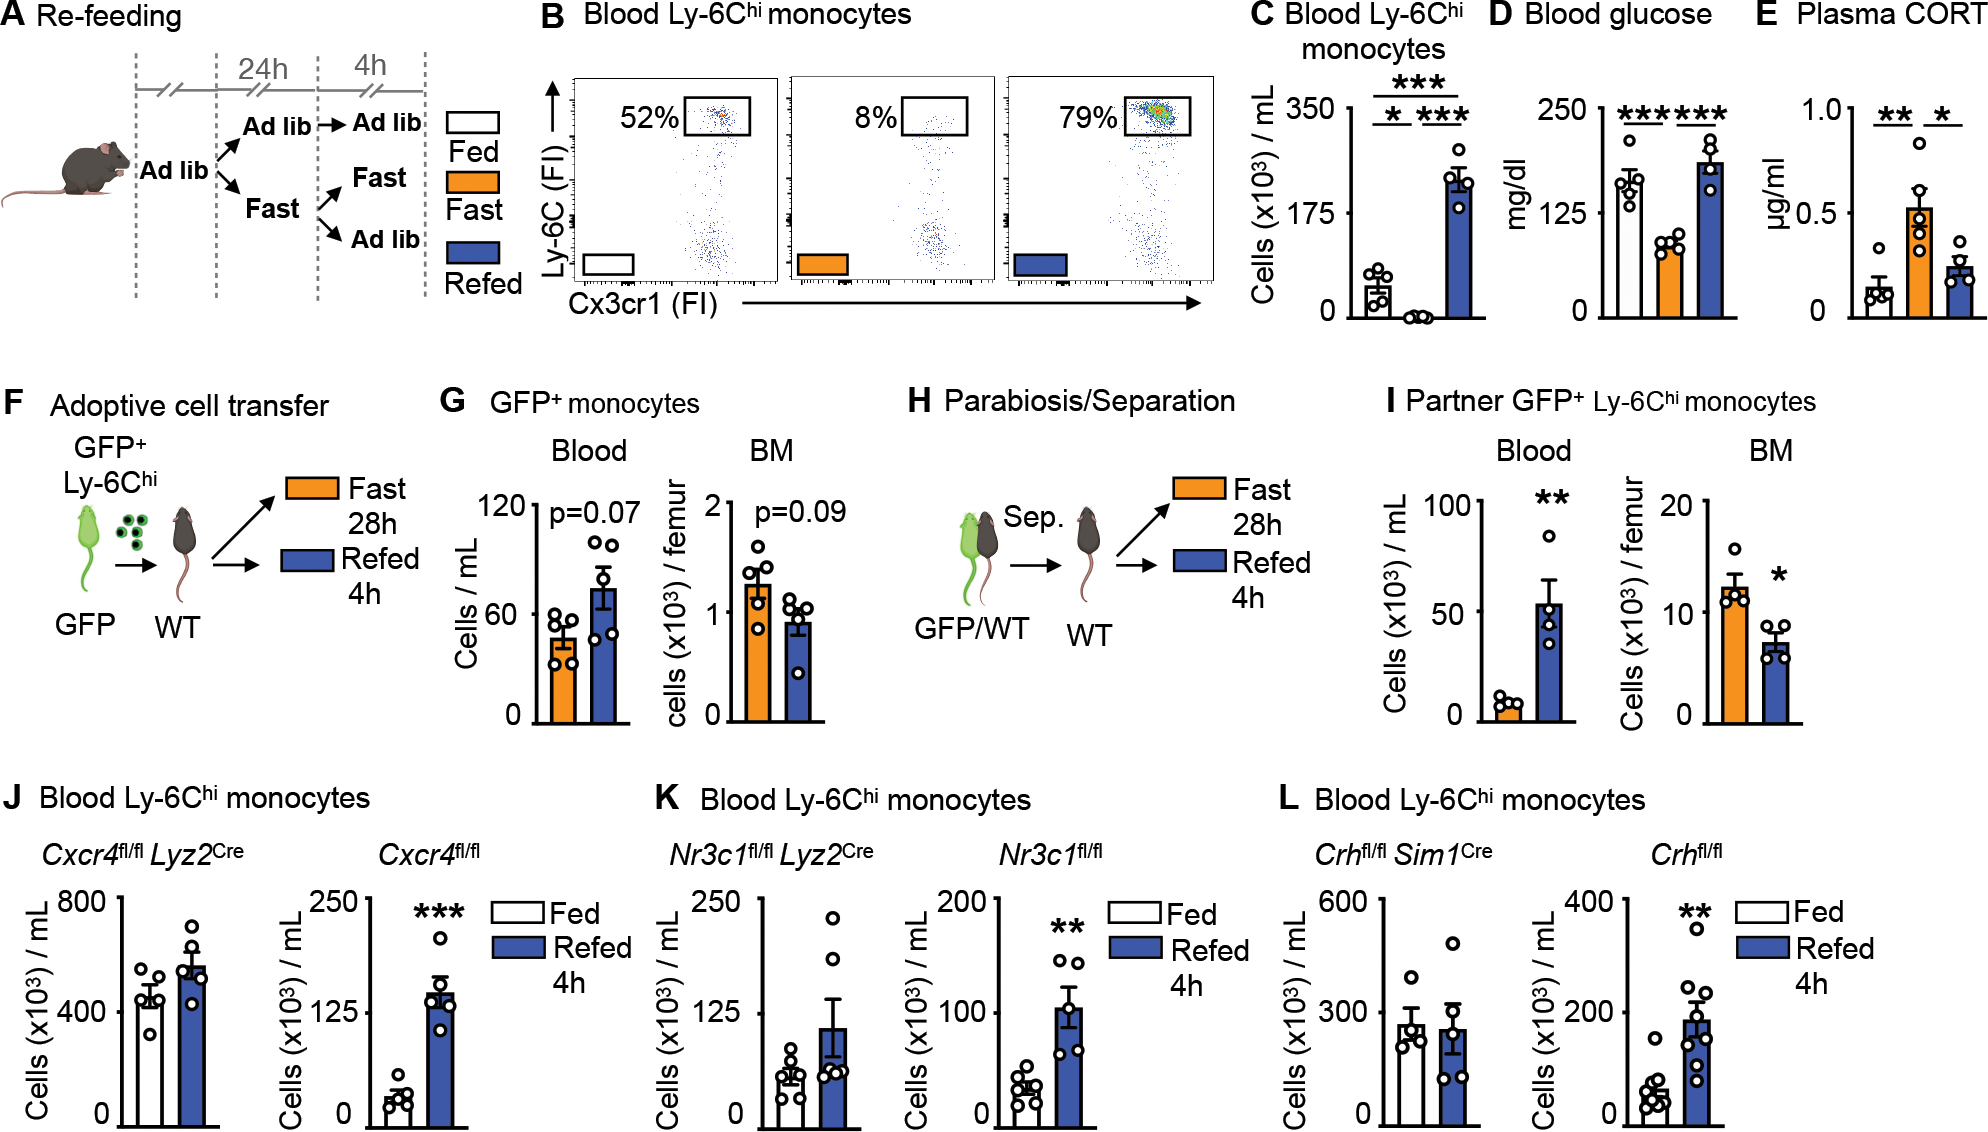
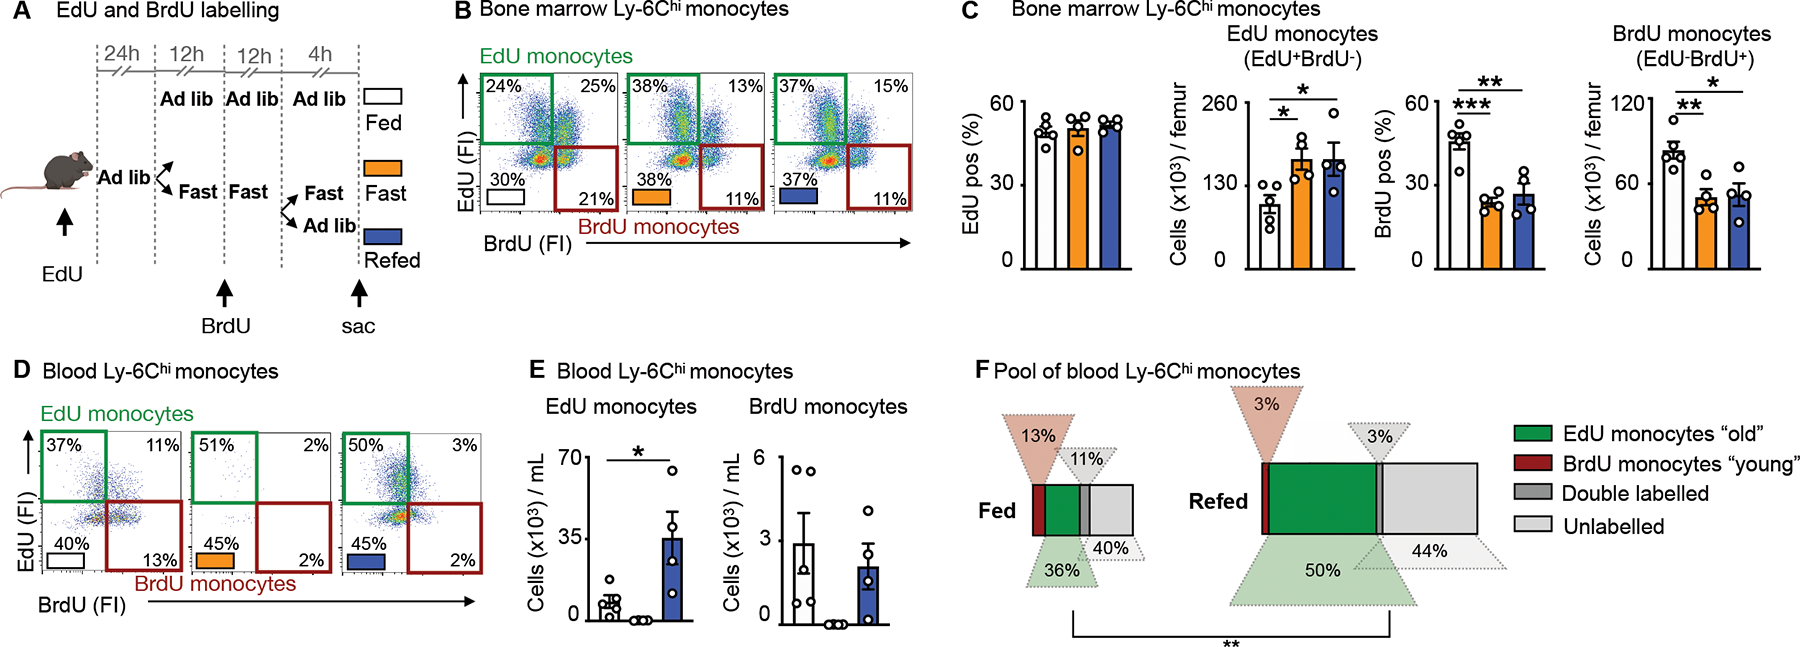
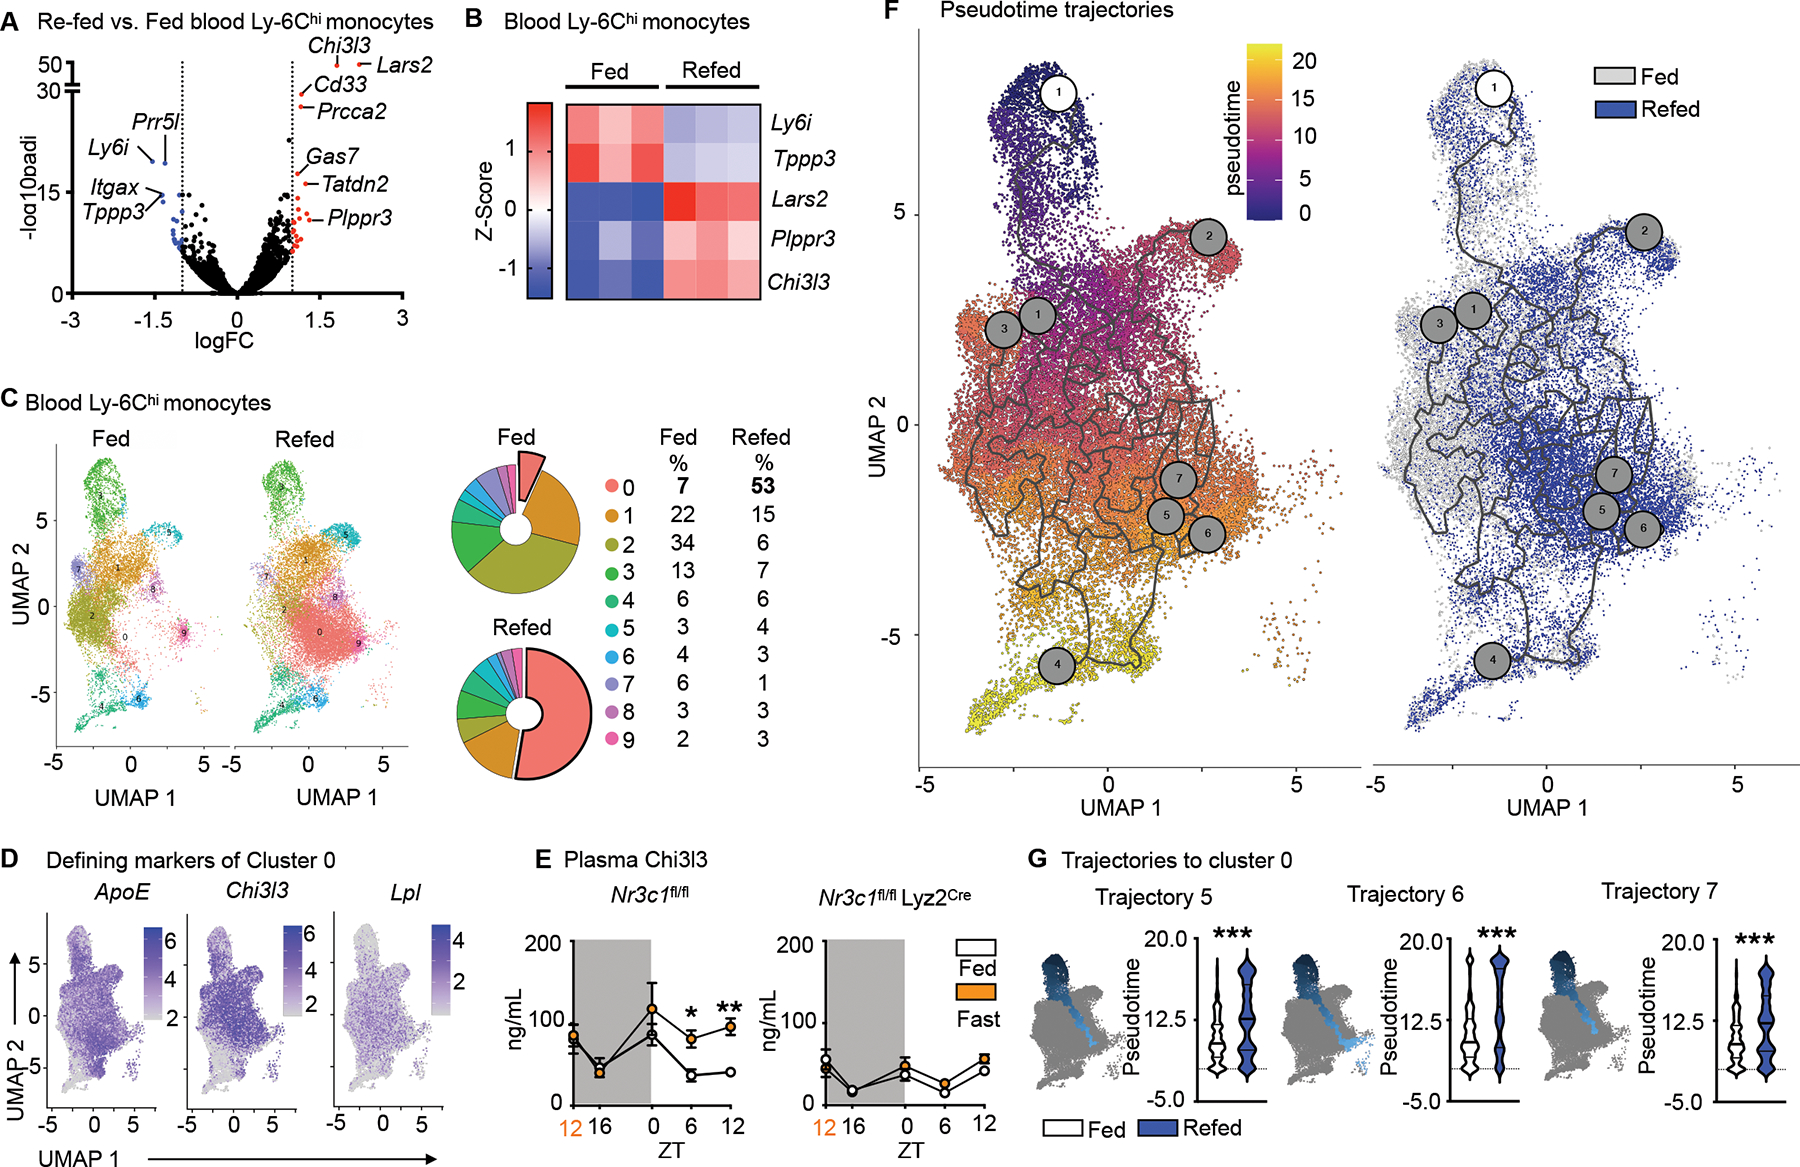
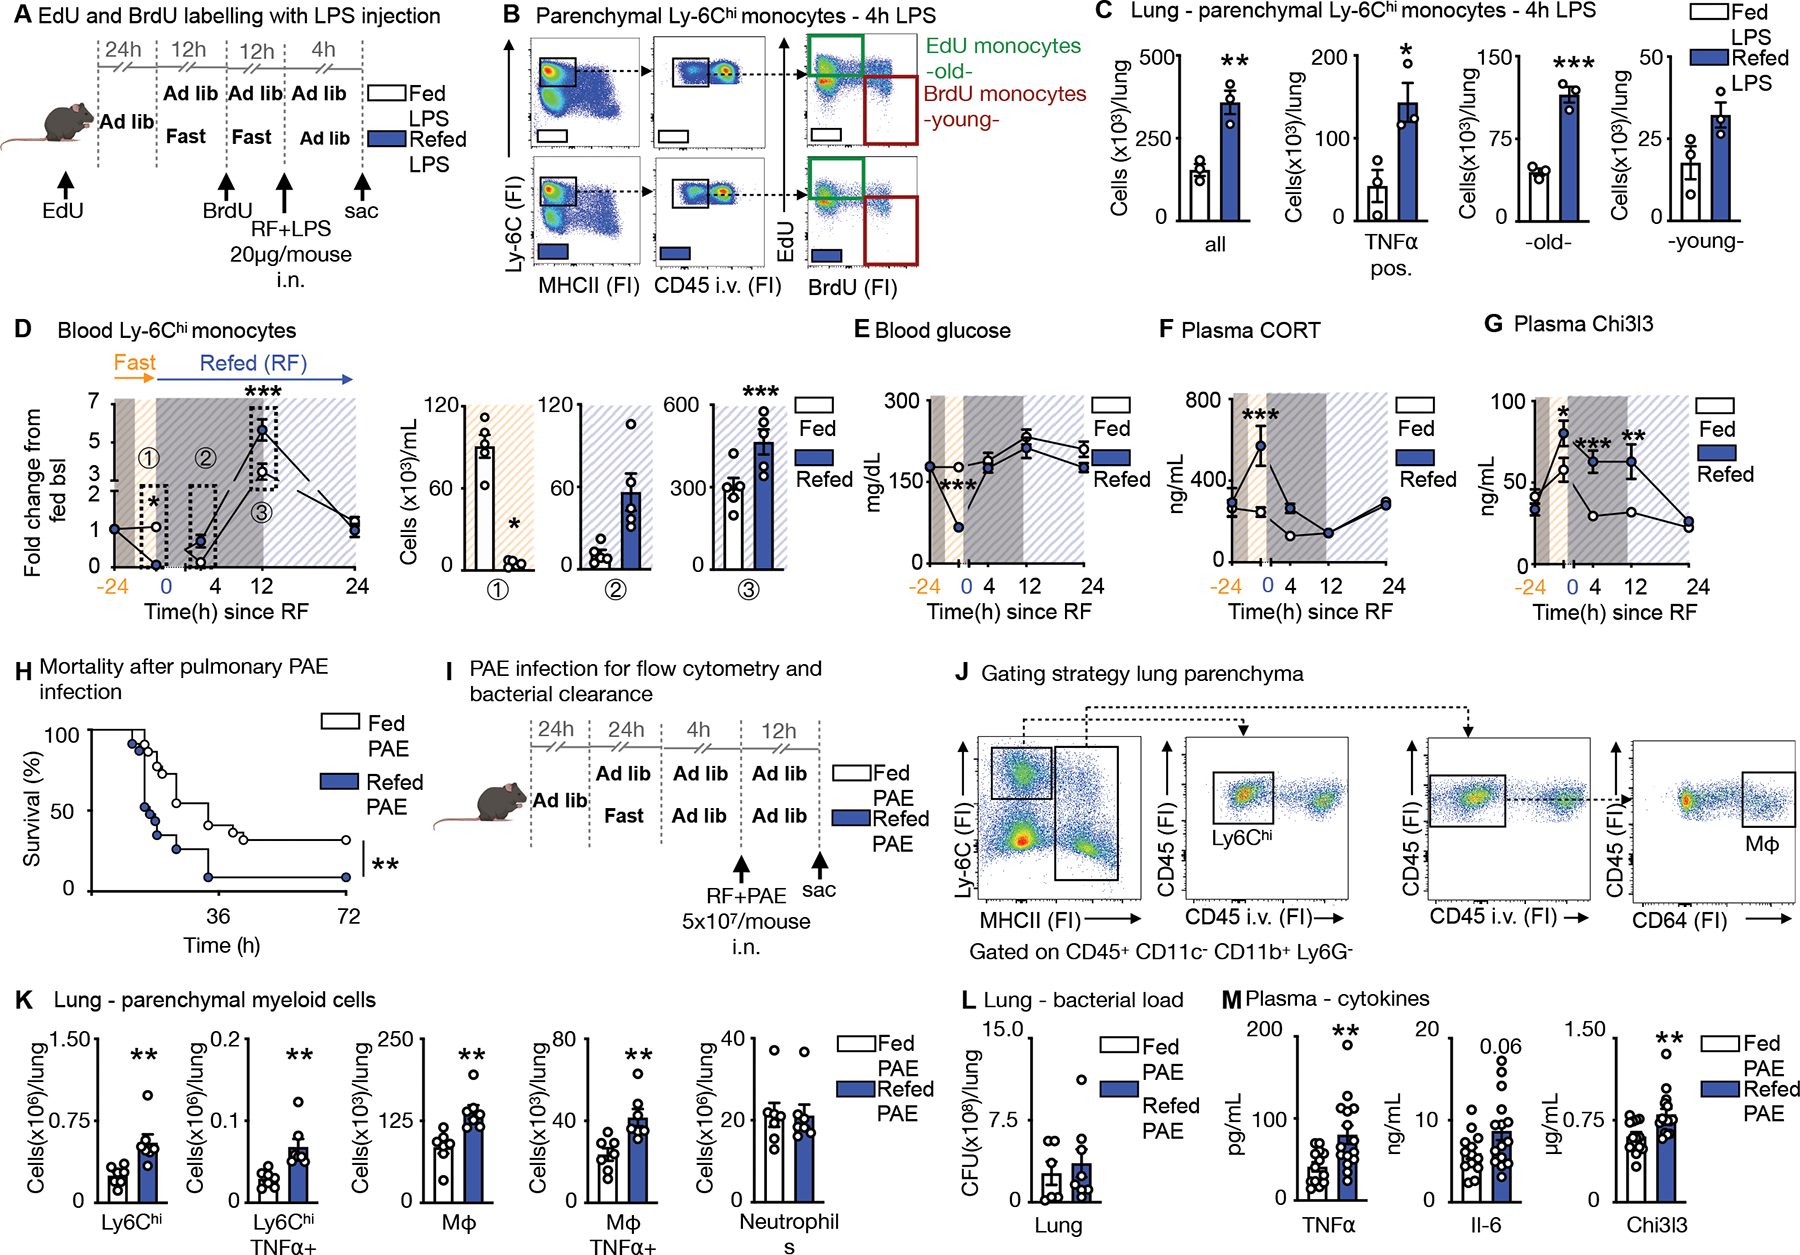
Diet profoundly influences physiology. Whereas over-nutrition elevates risk for disease via its influence on immunity and metabolism, caloric restriction and fasting appear to be salutogenic. Despite multiple correlations observed between diet and health, the underlying biology remains unclear. Here, we identified a fasting-induced switch in leukocyte migration that prolongs monocyte lifespan and alters susceptibility to disease in mice. We show that fasting during the active phase induced the rapid return of monocytes from the blood to the bone marrow. Monocyte re-entry was orchestrated by hypothalamic-pituitary-adrenal (HPA) axis-dependent release of corticosterone, which augmented the CXCR4 chemokine receptor. Although the marrow is a safe haven for monocytes during nutrient scarcity, re-feeding prompted mobilization culminating in monocytosis of chronologically older and transcriptionally distinct monocytes. These shifts altered response to infection. Our study shows that diet-in particular, a diet's temporal dynamic balance-modulates monocyte lifespan with consequences for adaptation to external stressors.

Keywords: bone marrow; corticosterone; fasting; hematopoiesis; hypothalamus; infection; monocyte.


Conflict of interest statement

Declaration of interests M.N. has received funding or material research support from Alnylam, Biotronik, CSL Behring, GlycoMimetics, GSK, Medtronic, Novartis, and Pfizer as well as consulting fees from Lilly, Biogen, Gimv, IFM Therapeutics, Molecular Imaging, Sigilon, and Verseau Therapeutics. F.K.S. has received funds or material research support from Novartis, Partner Therapeutics, Pfizer, and Verseau Therapeutics.

Figures

Figure 1:
Figure 1:. Fasting reorganizes the leukocyte distribution landscape
A. Relative shifts of major leukocyte populations in depicted organs compared between mice fed ad libitum and after a 24h fast. Baseline cell content in each organ is defined as “5 cells”. Fasted results are calculated in relative relation to fed. Ly-6Chi monocytes are defined as CD45+ CD11b+ LIN1(CD19, CD3, NK 1.1, CD90−) Ly-6G CX3CR1+ Ly-6Chi, neutrophils as CD45+ CD11b+ LIN1 Ly-6G+, T cells as CD45+ CD11b LIN1+ MHCII, B cells as CD45+ CD11b LIN1+ MHCII+. Absolute numbers for each organ are depicted in Table 1. (n=3–5 mice per group). Unpaired t test. B. Representative gating strategy of all major leukocyte populations in the blood. C. Absolute blood leukocyte count and blood glucose concentration divided by inactive (light) and active (dark) period compared between mice fed ad libitum or fasted for up to 12h. Orange zeitgeber (ZT) indicates start of the fast (n=3–10 per group). Two-way ANOVA. Data presented as mean ±SEM, *p < 0.05, **p<0.01, ***p < 0.001. Mono: Ly-6Chi monocytes, Neutro: Neutrophils, WAT: White adipose tissue, BAT: Brown adipose tissue, LP: Lamina propria, LN: Lymph node, AT: Adipose tissue, FI: Fluorescence intensity, ZT: Zeitgeber. Please also see Table 1 and Supplement Table 1.
Figure 2:
Figure 2:. Fasting returns Ly-6Chi monocytes back from circulation to the bone marrow
A. Ly-6Chi monocytes isolated from GFP positive mice were injected intravenously into wild type mice directly prior to initiation of a 24h fast or feeding ad libitum. B. Representative flow cytometry plots of GFP positive monocytes after feeding ad libitum and fasting in the blood. Adoptively transferred monocytes are defined as CD45+ GFP+. (n=5–6 per group, two independent experiments combined) C. Representative flow cytometry plots of GFP positive monocytes after feeding ad libitum and fasting in the bone marrow (BM). Adoptively transferred monocytes are defined as CD45+ GFP+. (n=5–6 per group, two independent experiments combined) D. Relative decrease of GFP positive monocytes in the blood and relative increase of GFP positive monocytes in the bone marrow after 24h fasting compared to fed control (n=5–6 per group, two independent experiments combined). Unpaired t test. E. Relative expression of target genes of sorted blood Ly-6Chi monocytes after 24h fasting normalized to fed control (n=3 mice per group). Unpaired t test. F. Circulating Ly-6Chi monocytes measured at indicated timepoints in Cxcr4fl/fl Lyz2Cre and Cxcr4fl/fl under fed and fasted conditions (n=4–10, timepoints are independent experiments). Start of the fast is indicated by orange zeitgeber (ZT). Two-way ANOVA. G. Plasma corticosterone (CORT) in Cxcr4fl/fl under fed and fasted conditions at indicated timepoints (n=4–8, timepoints are independent experiments). Start of the fast is indicated by orange zeitgeber (ZT). Two-way ANOVA. H. Relative expression of Cxcr4 on sorted blood Ly-6Chi monocytes after incubation with CORT (n=10 mice pooled for sort, n=3 technical replicates per group). Unpaired t test. I. Mice underwent bilateral adrenalectomy (ADX) or sham surgery and were allowed to recover for 2 weeks, prior to submission to feeding ad libitum or a 12h fast. Blood Ly-6Chi monocytes in mice 2 weeks post ADX or sham surgery after fasting compared to fed ad libitum (n=4–6 per group). Unpaired t test. J. Blood Ly-6Chi monocytes measured at indicated times in Nr3c1fl/fl Lyz2Cre and Nr3c1fl/fl under fed and fasted conditions (n=4–11, timepoints areindependent experiments). Start of the fast is indicated by orange ZT. Two-way ANOVA. K. Blood Ly-6Chi monocytes in Crhfl/fl Sim1Cre and Crhfl/fl after 4h of fasting compared to fed ad libitum (n=3–6 per group). Unpaired t test. Data presented as mean ±SEM, *p < 0.05, **p<0.01, ***p < 0.001. FI: Fluorescence intensity, BM: Bone marrow, CORT: Corticosterone, ADX: Adrenalectomy. Please also see Figure S1.
Figure 3:
Figure 3:. Re-feeding leads to a surge of monocytes into the bloodstream
A. Mice were fasted for 24h and divided into further fasting or re-feeding for 4h. Control mice were fed ad libitum. B. Representative flow cytometry plots of blood Ly-6Chi monocytes after feeding ad libitum, fasting for 28h or fasting for 24h followed by 4h of re-feeding. Ly-6Chi monocytes are defined as CD45+ CD11b+ LIN1 Ly-6G CX3CR1+ Ly-6Chi (n=4–5 per group). C. Blood Ly-6Chi monocytes after feeding ad libitum, fasting or fasting+re-feeding (n=4–5 per group). One-way ANOVA. D. Blood glucose concentration after feeding ad libitum, fasting or fasting+re-feeding (n=4–5 per group). One-way ANOVA. E. Plasma corticosterone (CORT) concentration after feeding ad libitum, fasting or fasting+re-feeding (n=4–5 per group). One-way ANOVA F. Ly-6Chi monocytes sorted from GFP positive mice were injected intravenously into wild type mice directly prior to submission to 28h of fasting or 24h of fasting and 4h of re-feeding. G. Adoptively transferred monocytes in the blood and bone marrow (BM) of wild type recipients. Adoptively transferred monocytes are defined as CD45+ GFP+. (n=5 per group). Unpaired t test. H. Parabiosis of GFP positive and wild type mice. After two weeks, mice were separated and wild type mice were either fasted for 28h or fasted for 24h followed by 4h of re-feeding. I. GFP positive Ly-6Chi monocytes in the blood and BM of wild type parabionts after fasting or fasting+re-feeding. (n=4 per group). Unpaired t test. J. Blood Ly-6Chi monocytes in Cxcr4fl/fl Lyz2Cre and Cxcr4fl/fl after feeding ad libitum or fasting+re-feeding (n=5 per group). Unpaired t test. K. Blood Ly-6Chi monocytes in Nr3c1fl/fl Lyz2Cre and Nr3c1fl/fl after feeding ad libitum or fasting+re-feeding (n=5–6 per group). Unpaired t test. L. Blood Ly-6Chi monocytes in Crhfl/fl Sim1Cre and Crhfl/fl after feeding ad libitum or fasting+re-feeding (n=4–8 per group). Unpaired t test. Data presented as mean ±SEM, *p < 0.05, **p<0.01, ***p < 0.001. FI: Fluorescence intensity CORT: Corticosterone, BM: Bone marrow. Please also see Figure S2.
Figure 4:
Figure 4:. The monocyte surge is dominated by aged Ly-6Chi monocytes
A. EdU and BrdU were sequentially injected for labelling of Ly-6Chi monocytes under feeding ad libitum, fasting and fasting+re-feeding conditions. EdU was injected 24h prior to fasting. BrdU was injected half-way through the fast. After a 24h fast, fasted mice were divided into groups submitted to a further 4h fast or 4h of re-feeding. B. Representative flow cytometry plots for Ly-6Chi monocytes in the bone marrow under conditions of feeding ad libitum, fasting and fasting+re-feeding. Ly-6Chi monocytes are defined as CD45+ CD11b+ LIN1 Ly-6G CX3CR1+ Ly-6Chi. “EdU monocytes” are Ly-6Chi monocytes with EdU-only label (labelled prior to fasting). “BrdU monocytes” are Ly-6Chi monocytes with BrdU-only label (labelled under fasting). (n=4–5 per group) C. Relative EdU positivity of Ly-6Chi monocytes and absolute EdU Ly-6Chi monocyte count under feeding ad libitum, fasting and fasting+re-feeding conditions in the bone marrow. Relative BrdU positivity of Ly-6Chi monocytes and absolute BrdU Ly-6Chi monocyte count under feeding ad libitum, fasting and fasting+re-feeding conditions in the bone marrow (n=4–5 per group). One-way ANOVA. D. Representative flow cytometry plots for Ly-6Chi monocytes in the blood under conditions of feeding ad libitum, fasting and fasting+re-feeding. Ly-6Chi monocytes are defined as CD45+ CD11b+ LIN1 Ly-6G CX3CR1+ Ly-6Chi. “EdU monocytes” are Ly-6Chi monocytes with EdU-only label (labelled prior to fasting). “BrdU monocytes” are Ly-6Chi monocytes with BrdU-only label (labelled under fasting). (n=4–5 per group) E. Absolute count of EdU monocytes and BrdU monocytes in the blood under feeding, fasting or fasting+re-feeding conditions (n=4–5 per group). One-way ANOVA. F. Relative quantification of Ly-6Chi monocyte subpopulations, based on EdU and BrdU label in the blood after feeding or fasting+re-feeding conditions (n=4–5 per group). The surface of the rectangle resembles the size of the whole pool of Ly-6Chi monocytes in the blood. EdU monocytes can be considered chronologically older (“old”) than BrdU monocytes (“young”) (n=4–5 per group). Chi-square test. Data presented as mean ±SEM, *p < 0.05, **p<0.01, ***p < 0.001. Please also see Figure S3.
Figure 5:
Figure 5:. Fasting and re-feeding generates a chronologically older and transcriptionally distinct monocyte population
A. Volcano plot indicating differentially regulated genes (FC>1.0, FDR<0.05, p<0.05) of sorted blood Ly-6Chi monocytes after feeding ad libitum or fasting for 24h followed by 4h re-feeding. (n=3 samples per group, 4 mice pooled per sample). B. Heatmap of differentially expressed genes after conservative hierarchical clustering of sorted blood Ly-6Chi monocytes after feeding ad libitum or fasting+re-feeding. (n=3 samples per group, 4 mice pooled per sample) C. UMAP representations, colored by clusters computed by FindClusters function of Seurat and relative representation of the clusters of sorted blood Ly-6Chi monocytes under fed and fasting+re-fed conditions. (n=1 sample per group, 5 mice pooled per sample) D. Expression of Top 3 defining marker genes of cluster 0 visualized by feature plots. E. Plasma Chi3l3 in Nr3c1fl/fl and Nr3c1fl/fl Lyz2Cre under feeding ad libitum or fasting conditions. Orange zeitgeber (ZT) indicates start of the fast (n=4–12, timepoints are independent experiments). Two-way ANOVA. F. Pseudotime computed with Monocle 3. The white circled 1 indicates the root cell from where pseudotime analaysis begins. Gray circles correspond to the different outcomes in the trajectory. UMAP representation overlaying conditions of feeding ad libitum and fasting+re-feeding. G. Pseudotime of trajectories 5, 6 and 7 projecting into cluster 0 in mice under feeding ad libitum and fasting+re-feeding. Kolmogorov-Smirnov test. Data presented as mean ±SEM, *p < 0.05, **p<0.01, ***p < 0.001. ZT: zeitgeber. Please also see Figure S4.
Figure 6
Figure 6. Fasting and re-feeding alters host response to infection
A. EdU and BrdU were sequentially injected for labelling of Ly-6Chi monocytes in mice under feeding ad libitum and fasting+re-feeding conditions. EdU was injected 24h prior to fasting. BrdU was injected half-way through the fast. After a 24h fast, fasted mice were refed for 4h. LPS (20μg/mouse) was administered intranasally at the timepoint of re-feeding and mice sacrificed 4h later. B. Representative flow cytometry plots for double labelling of Ly-6Chi monocytes in the lung parenchyma. Intravascular Ly-6Chi monocytes were excluded by intravenous CD45 staining prior to sacrifice. Ly-6Chi monocytes are defined as CD45+ CD11b+ LIN1 Ly-6G CX3CR1+ MHCII Ly-6Chi. EdU monocytes are Ly-6Chi monocytes with EdU-only label (labelled prior to fasting, old). BrdU monocytes are Ly-6Chi monocytes with BrdU-only label (labelled under fasting, young). (n=3 per group) C. Absolute count of Ly-6Chi monocytes and TNFα-positive Ly-6Chi monocytes in the parenchyma after intranasal LPS challenge in mice undergoing feeding ad libitum or fasting+re-feeding. Absolute counts of “old” and “young” Ly-6Chi monocytes in the parenychma. “Old” are Ly-6Chi monocytes with EdU-only label. “Young” are Ly-6Chi monocytes with BrdU-only label (n=3 per group). Unpaired t test. D. Blood Ly-6Chi monocytes under feeding or fasting+re-feeding conditions followed for 24h after re-feeding normalized to group’s baseline before fasting. Orange −24h indicates baseline before start of a 24h fast. Blue 0 indicates start of re-feeding. Bar graphs represent absolute Ly-6Chi monocytes counts of indicated timepoints (n=4–5 per group, timepoints are independent experiments). Two-way ANOVA. E. Blood glucose under feeding or fasting+re-feeding conditions followed for 24h after re-feeding. Orange −24h indicates baseline before start of a 24h fast. Blue 0 indicates start of re-feeding (n=4–5 per group, timepoints are independent experiments). Two-way ANOVA. F. Plasma corticosterone (CORT) under under feeding or fasting+re-feeding conditions followed for 24h after re-feeding. Orange −24h indicates baseline before start of a 24h fast. Blue 0 indicates start of re-feeding (n=4–5 per group, timepoints are independent experiments). Two-way ANOVA. G. Plasma Chi3l3 concentration under feeding or fasting+re-feeding conditions followed for 24h after re-feeding. Orange −24h indicates baseline before start of a 24h fast. Blue 0 indicates start of re-feeding (n=4–5 per group, timepoints are independent experiments). Two-way ANOVA. H. Mice were infected intranasally with Pseudomonas aeruginosa (PAE) at a dose of 5×10⁷/mouse. Refed mice were infected after a 24h fast, followed by a 4h re-feeding period. Control mice were fed ad libitum and both groups followed for survival (n= 22–23 per group, two independent experiments combined). Log-rank (Mantel-Cox) test. I. Fed ad libitum mice and mice after 24h fast followed by 4h of re-feeding were intranasally infected with PAE at a dose of 5×10⁷/mouse and sacrificed 12h after. J. To distinguish between circulating and parenchymal leukocytes, CD45 was injected i.v. before sacrifice. Representative gating strategy for flow cytometery on parenchymal Ly-6Chi monocytes defined as CD45+CD11cCD11b+Ly6GLy-6Chi MHCII and macrophages (Mφ) defined as CD45+CD11cCD11b+Ly6GMHCII+CD64+ in the lung. (n=7 per group) K. Parenchymal myeloid cell content in the lung after infection with PAE as described in panel I (n=7 per group). Unpaired t test. L. Bacterial load after infection as described in panel I from homogenized lungs comparing fed and fasted+re-fed mice (n=6–8 per group). Unpaired t test. M. Plasma concentration of cytokines after infection as described in panel I (n=13–15 per group, two experiments combined). Unpaired t test. Data presented as mean ±SEM, *p < 0.05, **p<0.01, ***p < 0.001. FI: Fluorescence intensity, RF: Re-feeding, PAE: Pseudomonas aeruginosa, Mφ: Macrophages. Please also see Figure S5 and S6.

Comment in

Similar articles

Cited by

References

    1. Dehghan M et al. (2017). Associations of fats and carbohydrate intake with cardiovascular disease and mortality in 18 countries from five continents (PURE): a prospective cohort study. Lancet 390, 2050–2062. - PubMed
    1. Flegal KM, Kit BK, Orpana H, and Graubard BI (2013). Association of all-cause mortality with overweight and obesity using standard body mass index categories: a systematic review and meta-analysis. JAMA 309, 71–82. - PMC - PubMed
    1. Yang Q, Zhang Z, Gregg EW, Flanders WD, Merritt R, and Hu FB (2014). Added sugar intake and cardiovascular diseases mortality among US adults. JAMA Intern Med 174, 516–524. - PMC - PubMed
    1. Lumeng CN, and Saltiel AR (2011). Inflammatory links between obesity and metabolic disease. J Clin Invest 121, 2111–2117. - PMC - PubMed
    1. Ma T et al. (2011). Sucrose counteracts the anti-inflammatory effect of fish oil in adipose tissue and increases obesity development in mice. PLoS One 6, e21647. - PMC - PubMed

Publication types