. 2023 May 1;220(5):e20221346.
doi: 10.1084/jem.20221346. Epub 2023 Feb 24.

Age-associated B cells are heterogeneous and dynamic drivers of autoimmunity in mice

Affiliations

Age-associated B cells are heterogeneous and dynamic drivers of autoimmunity in mice

Kevin M Nickerson et al. J Exp Med. .

Abstract

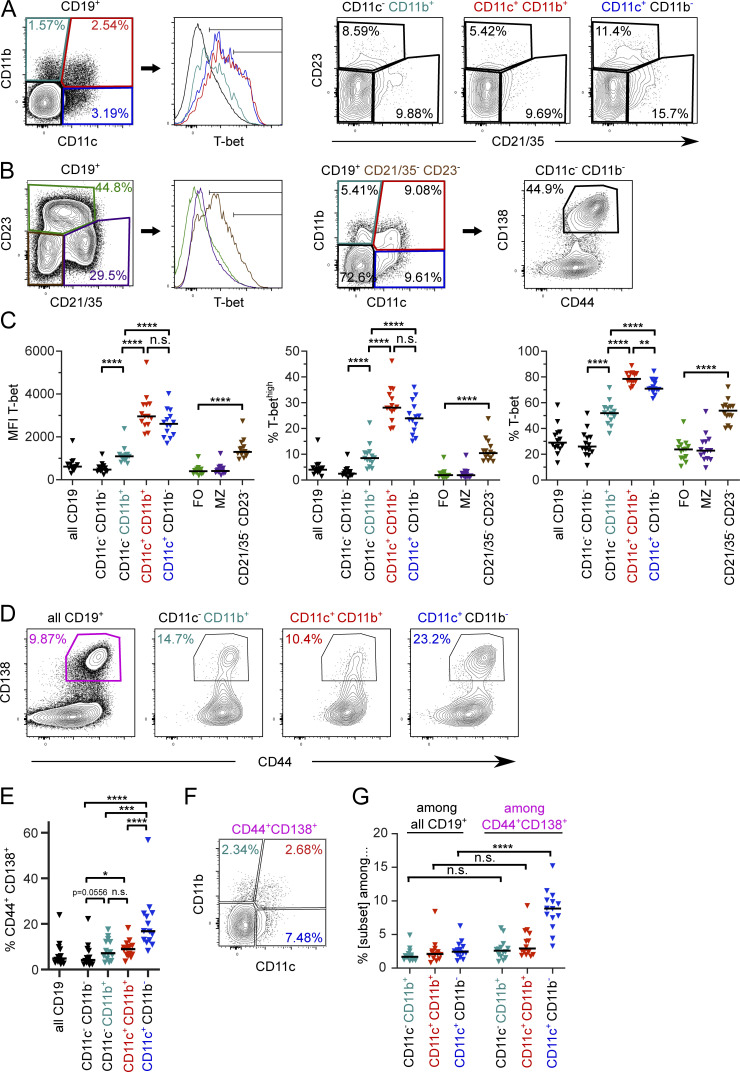
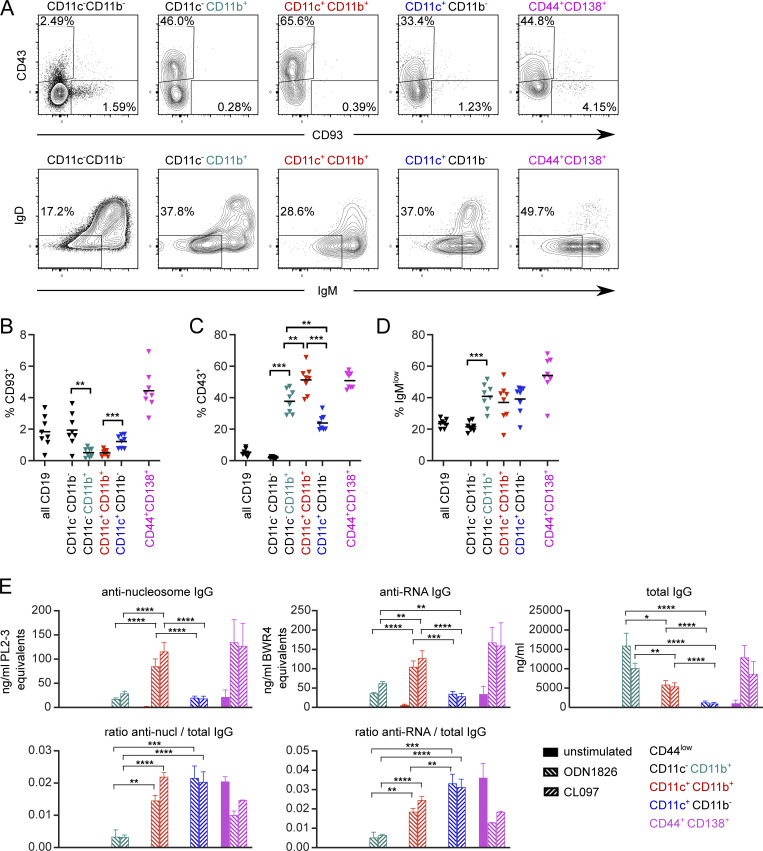
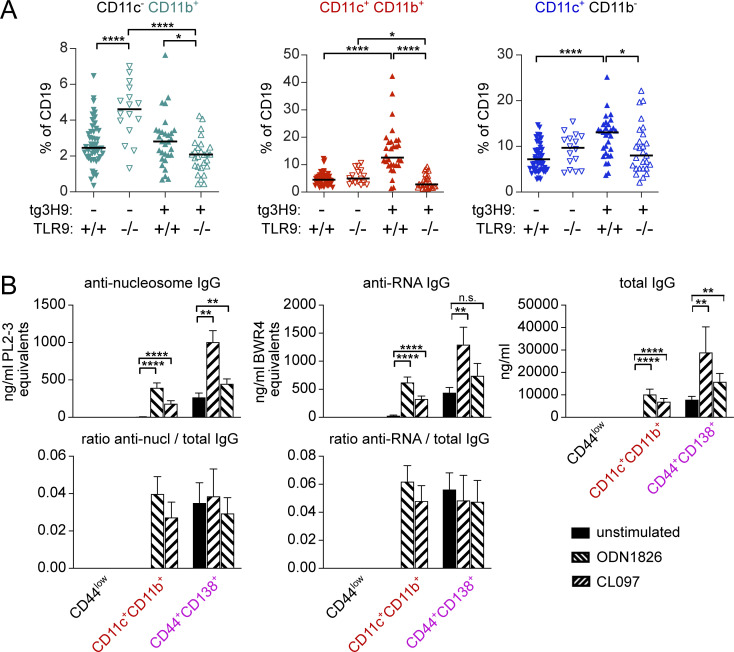
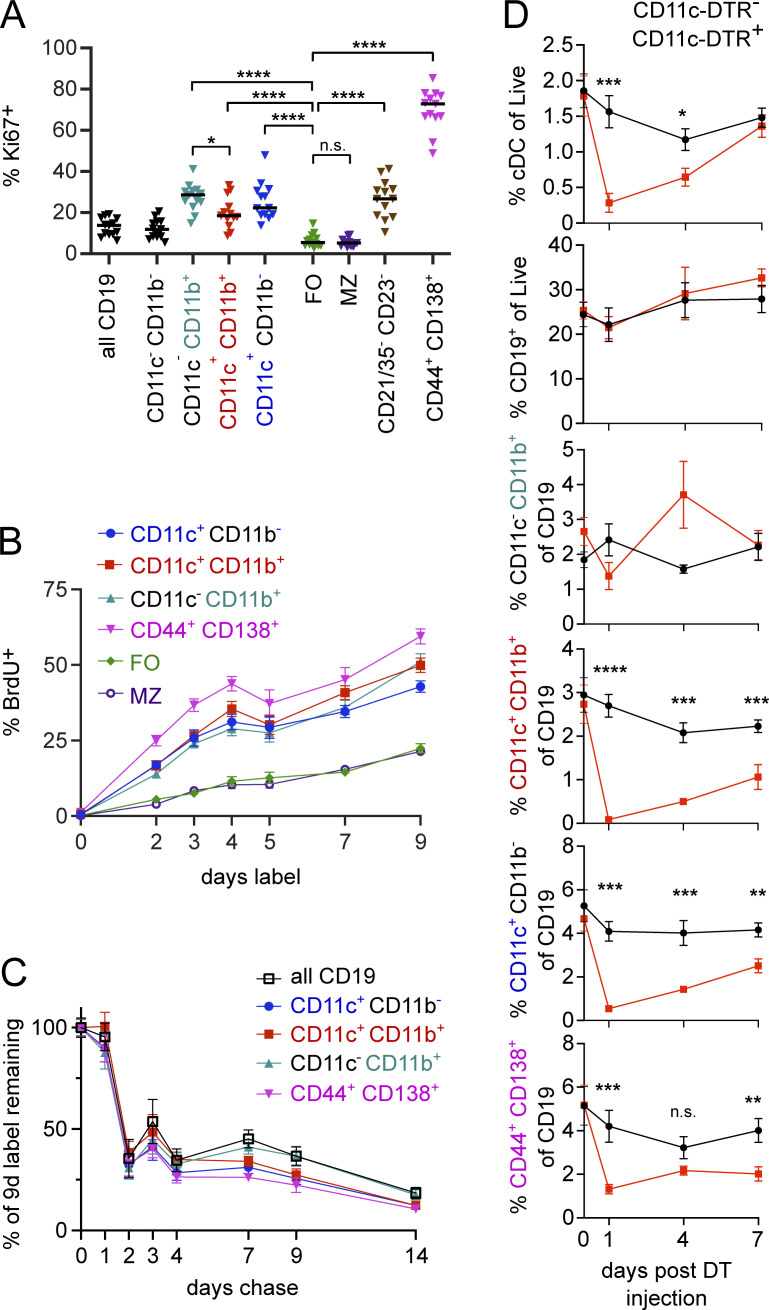
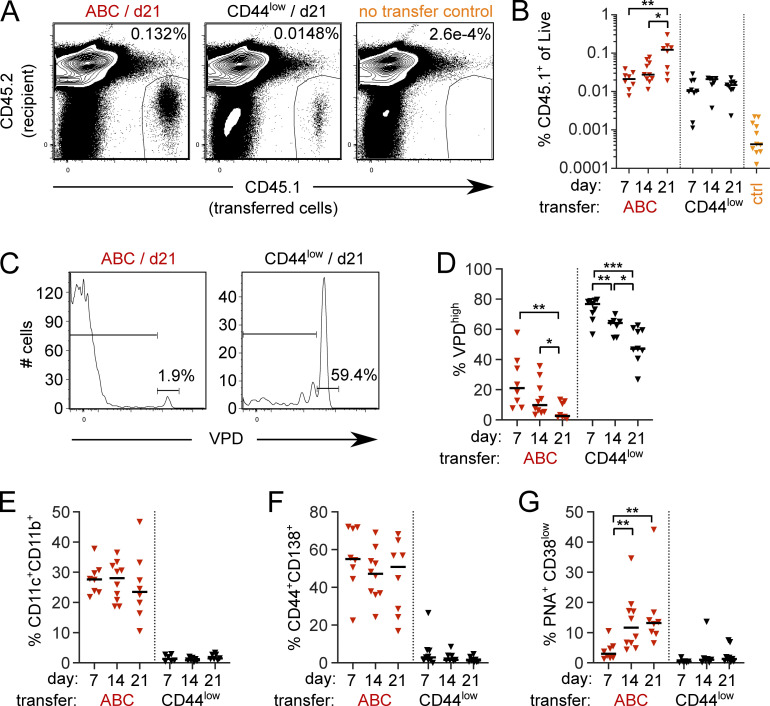
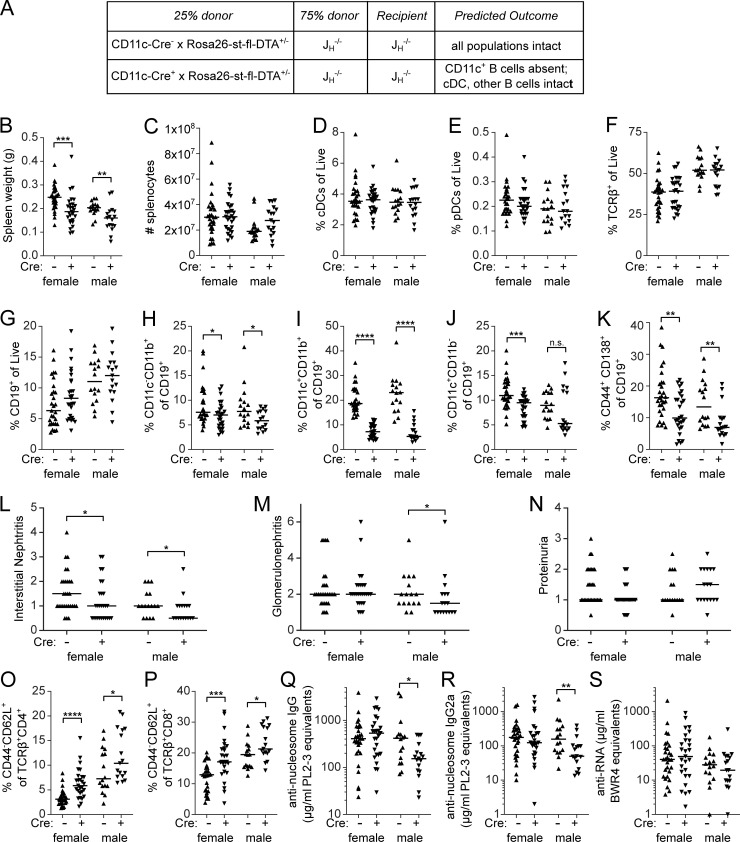
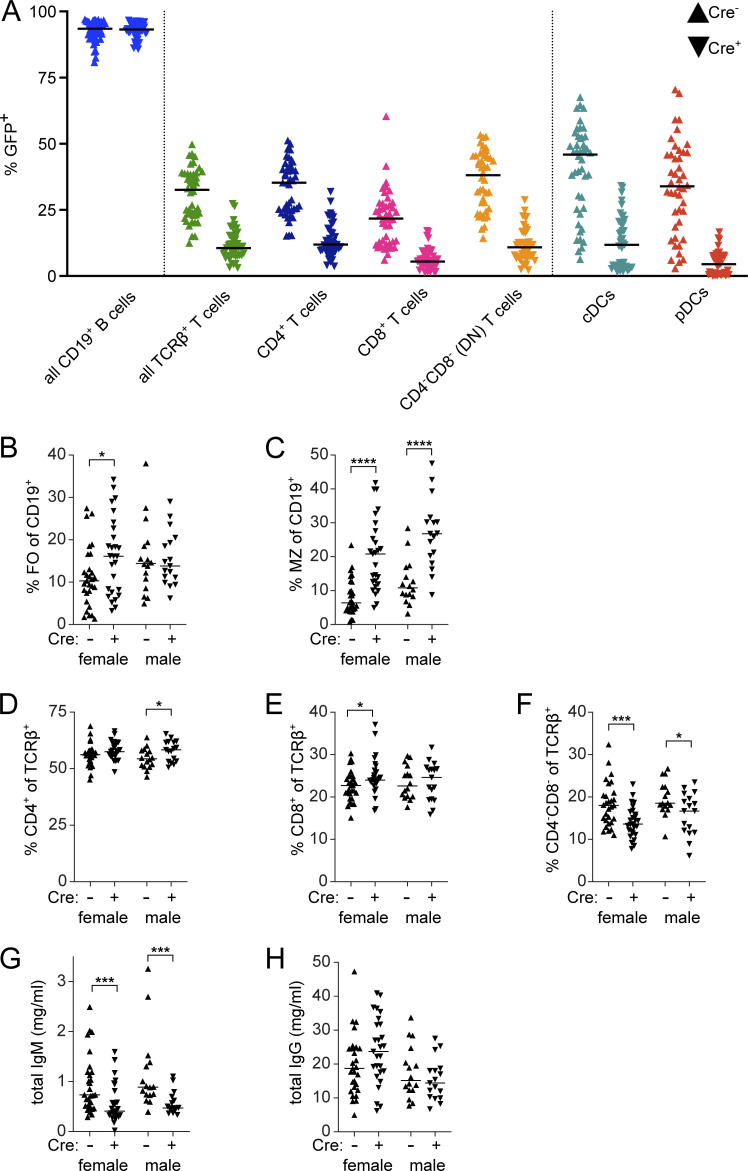
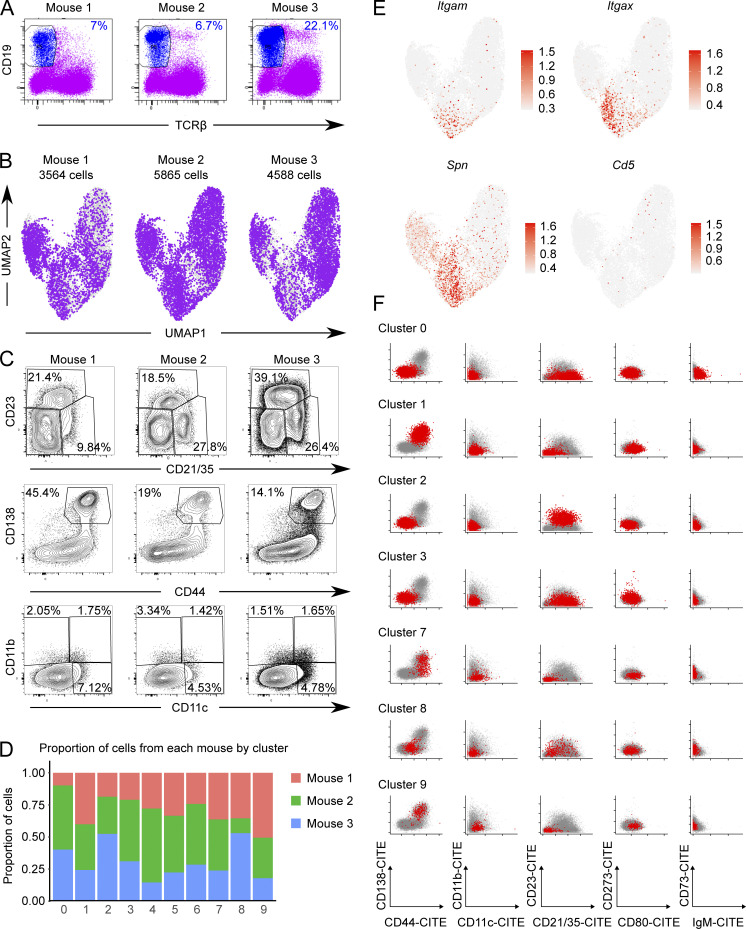
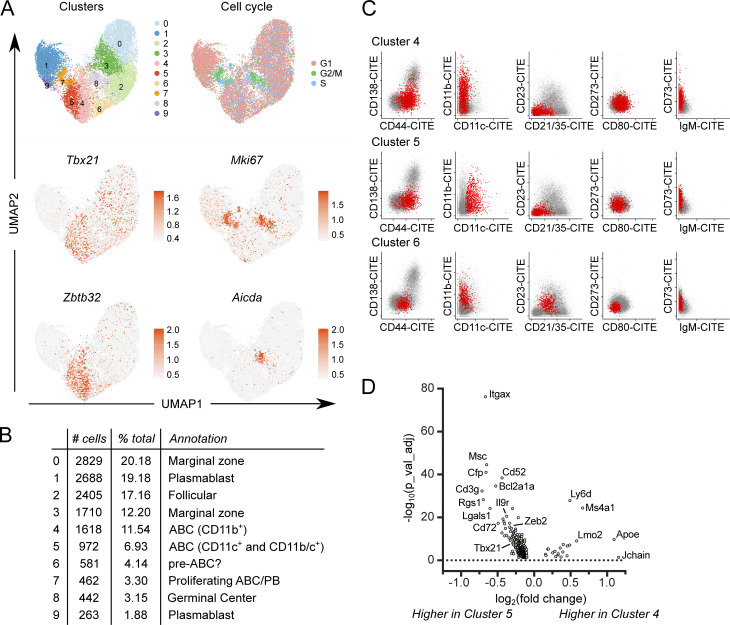
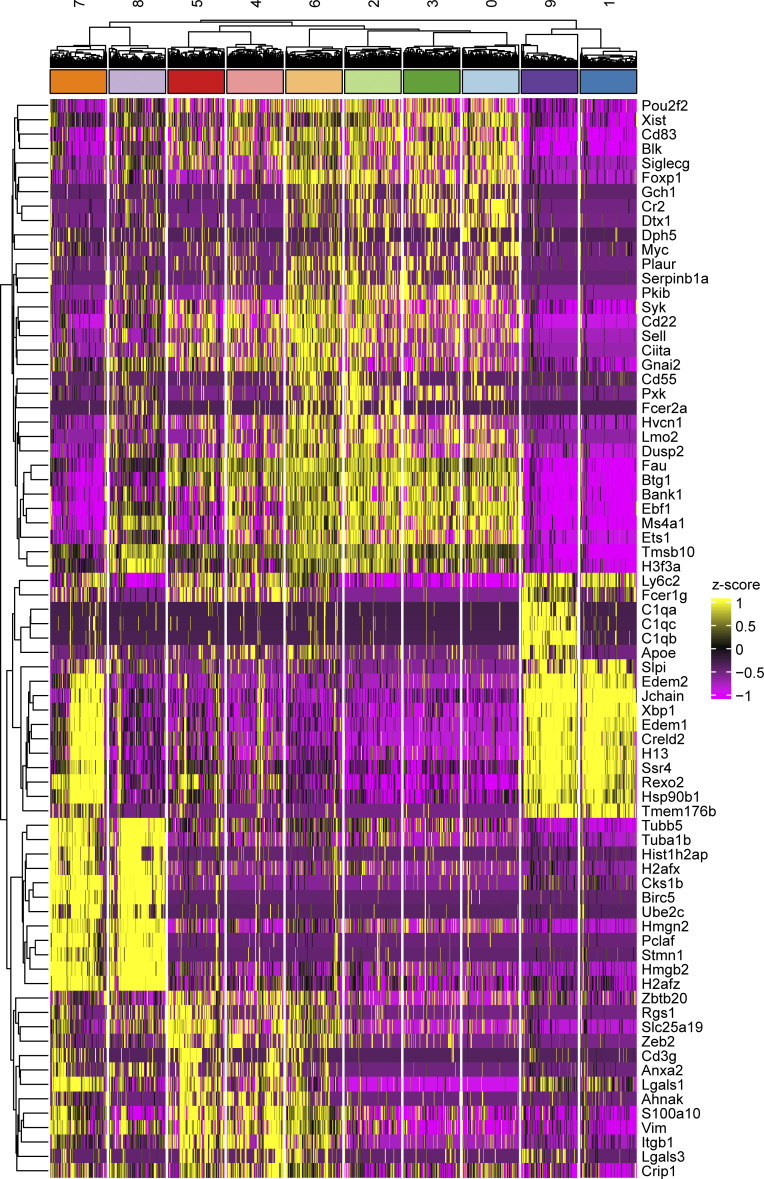
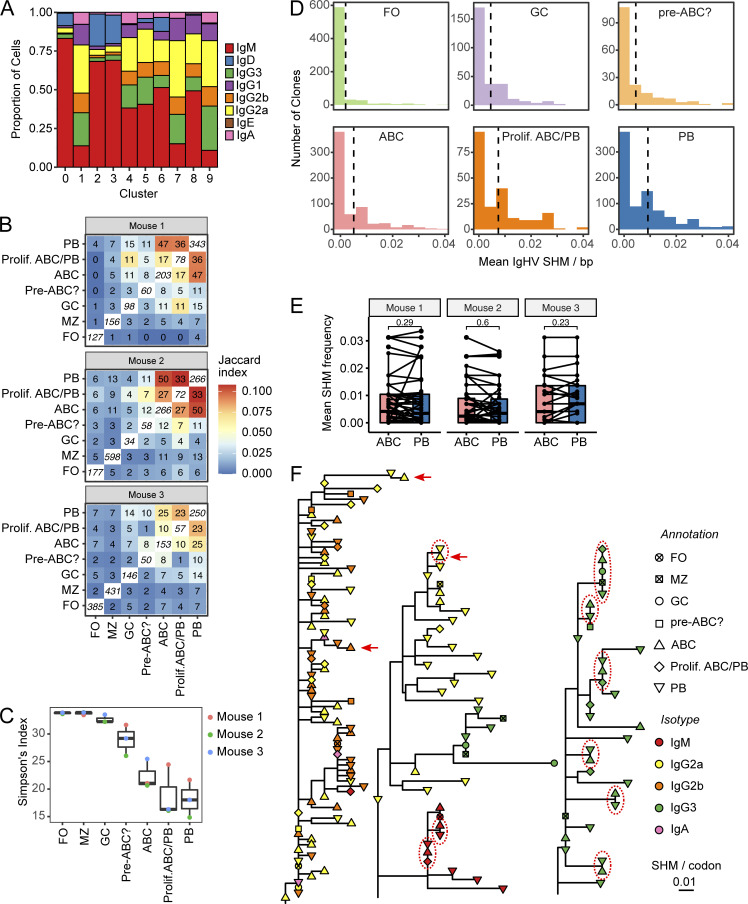
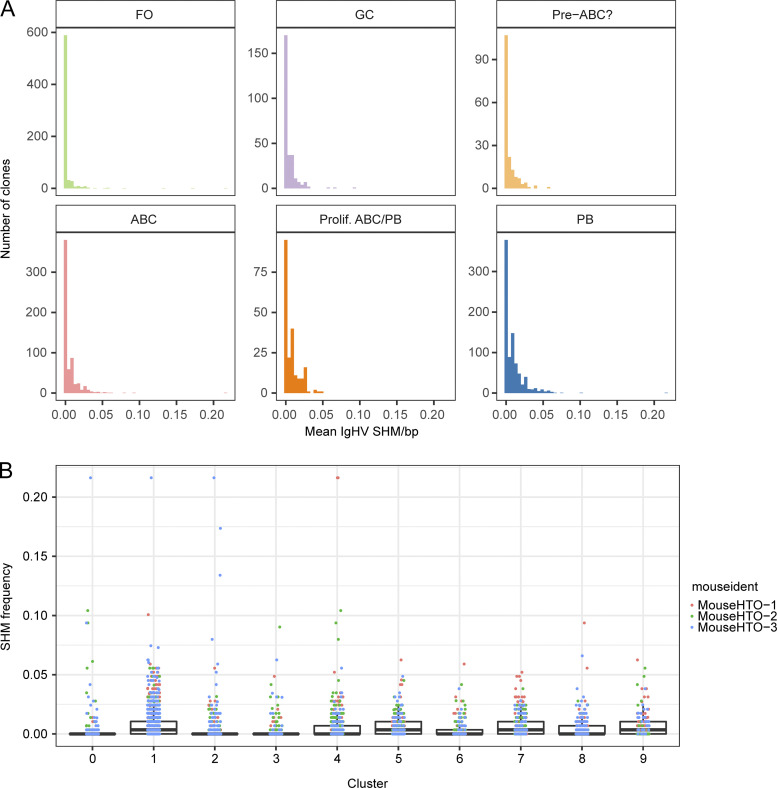
Age-associated B cells (ABCs) are formed under inflammatory conditions and are considered a type of memory B cell (MBC) expressing the transcription factor T-bet. In SLE, ABC frequency is correlated with disease, and they are thought to be the source of autoantibody-secreting cells. However, in inflammatory conditions, whether autoreactive B cells can become resting MBCs is uncertain. Further, the phenotypic identity of ABCs and their relationship to other B cell subsets, such as plasmablasts, is unclear. Whether ABCs directly promote disease is untested. Here we report, in the MRL/lpr SLE model, unexpected heterogeneity among ABC-like cells for expression of the integrins CD11b and CD11c, T-bet, and memory or plasmablast markers. Transfer and labeling studies demonstrated that ABCs are dynamic, rapidly turning over. scRNA-seq identified B cell clones present in multiple subsets, revealing that ABCs can be plasmablast precursors or undergo cycles of reactivation. Deletion of CD11c-expressing B cells revealed a direct role for ABC-like B cells in lupus pathogenesis.


Conflict of interest statement

Disclosures: K.B. Hoehn reported personal fees from Prellis Biologics outside the submitted work. S.H. Kleinstein reported consulting fees from Peraton. No other disclosures were reported.

Figures

Figure 1.
Figure 1.
ABC-like cells are heterogeneous with respect to expression of T-bet and PB markers. Splenocytes from seven female and seven male MRL/lpr at 18 wk of age were stained as indicated. (A) Representative CD11c, CD11b, and T-bet staining in CD11cCD11b+ (teal), CD11c+CD11b+ (red), CD11c+CD11b (dark blue) or CD11cCD11b (black) CD19+ B cells. Representative CD21/35 versus CD23 staining from the subsets as gated in the leftmost plot. (B) Representative CD21/35, CD23, and T-bet staining in the same animal as A, indicating FO (green), MZ (purple), or CD21/35CD23 (brown) T-bet expression. Representative CD11c vs. CD11b staining of CD21/35CD23cells and CD44 vs. CD138 staining of CD19+CD21/35CD23CD11cCD11b cells. (C) Mean fluorescence intensity (MFI) of T-bet staining in the populations shown in A and B. (D) Representative CD44+ CD138+ staining in total CD19+ B cells or indicated B cell subsets. (E) Frequency of CD44+ CD138+ cells among the indicated B cell subsets. (F) Representative CD11c and CD11b staining among all CD19+ CD44+ CD138+ PBs. (G) Frequency of CD11c and/or CD11b expression (as indicated) among total B cells or PBs. Horizontal lines indicate medians. Data are representative of at least three independent experiments. Statistical comparisons by two-tailed Mann-Whitney test; *P < 0.05; **P < 0.01; ***P < 0.001; ****P < 0.0001.
Figure S1.
Figure S1.
CD11c and CD11b ABC-like cells and PBs include CD43+ but not CD93+ populations in MRL/lpr and are frequently switched. Spleens were stained from four male and four female 16-wk-old MRL/lpr mice and analyzed on a Cytek Aurora. (A) Plot of CD93 and CD43 expression (top) and IgM vs. IgD surface staining (bottom) among CD19+ B cells gated on indicated subsets. (B) Frequency of CD93-positive staining among indicated subsets. (C) Frequency of CD43-positive staining among indicated subsets. (D) Frequency of IgMlowIgD cells among indicated subsets. (B–D) Horizontal lines indicate means. Data are representative of three experiments. (E) MRL/lpr splenocytes from 15- to 18-wk-old female mice were pooled, B-enriched, and sorted for CD44low cells (CD19+ CD11c CD11b CD44 CD138; black bars; below limit of detection), CD11b+ ABCs (CD19+ CD11c CD11b+ CD138; teal bars), CD11b+CD11c+ ABCs (CD19+ CD11c+ CD11b+ CD138; red bars), CD11c+ ABCs (CD19+ CD11c+ CD11b CD138; blue bars) or PBs (CD19+ CD44+ CD138+ CD11c CD11b; pink bars). Sorted cells were cultured for 6 d with media alone, 2 μg/ml ODN 1826 (TLR9 ligand), or 2 μg/ml CL097 (TLR7 ligand). Culture supernatants were harvested and secreted anti-nucleosome IgG, anti-RNA IgG, or total IgG were assessed by ELISA (top). The ratio of anti-nucleosome or anti-RNA to total IgG was calculated (bottom). Bars indicate mean + SEM. Data are pooled from two independent sorts with a total of 7–12 technical replicates (stimulation wells) except naive and CD44+CD138+ groups, which had 1–3 technical replicates. Statistical comparisons by two-tailed Mann-Whitney test; *P < 0.05; **P < 0.01; ***P < 0.001; ****P < 0.0001.
Figure 2.
Figure 2.
ABC-like cell subsets are heterogeneous in expression of MBC markers and do not account for all CD80 and PD-L2 expression among B cells. (A) Representative CD11c and CD11b staining on CD19+ splenocytes from a 15.5-wk female MRL/lpr. (B) Representative staining of CD80 and PD-L2 among all CD19+ B cells (far right) or indicated CD11c and/or CD11b B cell subsets. (C) Quantification of CD80 single-positive B cells among indicated subsets. (D) Quantification of CD80+ PD-L2+ B cells among indicated subsets. (E) Representative staining of CD73 in indicated B cell subsets. (F) Quantification of CD73+ cells among indicated B cell subsets. (G) Representative staining of CD11c and CD11b among total CD80+PD-L2 (top) or CD80+PD-L2+ (bottom) B cells. Summary data are pooled from five (C and D) or seven (F) independent experiments and include both male and female mice. Horizontal lines indicate medians. Statistical comparisons by two-tailed Mann-Whitney; *P < 0.05; **P < 0.01; ****P < 0.0001.
Figure 3.
Figure 3.
ABC-like cells are enriched for anti-nucleic acid reactivity. (A) Proportion of B cells expressing CD11b alone (teal), CD11c and CD11b (red), or CD11c (blue) in mice of the indicated 3H9 and TLR9 genotypes. (B) MRL/lpr splenocytes from 14- to 18-wk-old male or female mice were B-enriched and sorted for CD44low cells (CD19+ CD44 CD138), ABCs (CD19+ CD11c+ CD11b+ CD138), or PBs (CD19+ CD44+ CD138+ CD11c CD11b). Sorted cells were cultured for 6 d with media alone, 2 μg/ml ODN 1826 (TLR9 ligand), or 2 μg/ml CL097 (TLR7 ligand). Culture supernatants were harvested and secreted anti-nucleosome IgG, anti-RNA IgG, or total IgG were assessed by ELISA (top). The ratio of anti-nucleosome or anti-RNA to total IgG was calculated (bottom). Data are pooled from two independent sorts with at least eight technical replicates (stimulation wells) per condition. Bars indicate mean + SD. Statistical comparisons by two-tailed Mann-Whitney; *P < 0.05; **P < 0.01; ****P < 0.0001.
Figure 4.
Figure 4.
ABC-like cells are proliferative. (A) B cells of the indicated subsets were stained for Ki67 by flow cytometry. (B) MRL/lpr mice were provided BrdU in drinking water for the indicated durations and splenocytes were analyzed for incorporation of label. Data are pooled from four experiments. (C) MRL/lpr mice were provided BrdU in drinking water for 9 d and returned to normal drinking water for the indicated durations. BrdU incorporation was normalized to the average amount of label observed on d9 within each experiment for each subset. Data are pooled from two experiments. (D) CD11c-DTR+ MRL/lpr (red squares) or littermate controls (black circles) were given 8 ng/kg DT i.p. at 7, 4, or 1 d prior to analysis or left untreated. Splenocytes were analyzed for the presence of indicated cell types by flow cytometry. Statistics in A and D by two-tailed Mann-Whitney; *P < 0.05; **P < 0.01; ***P < 0.001; ****P < 0.0001.
Figure 5.
Figure 5.
CD11c+CD11b+ ABCs self-renew or differentiate. Sorted ABCs (CD19+ CD11c+ CD11b+ CD138) or CD44low B cells (CD19+ CD44low CD138 CD11c CD11b) isolated from spleens of CD45.1+ MRL/lpr females at 14–20 wk of age were VPD labeled and adoptively transferred into preautoimmune female CD45.2 MRL/lpr recipients. Recipient spleens were analyzed at d7, d14, or d21 following transfer. (A) Representative staining of total live splenocytes at d21 after transfer from mice receiving ABCs (left), CD44low B cells (middle), or no transfer controls (right). (B) Frequency of transferred CD45.1+ ABCs (red) or CD44low B cells (black) in recipient spleens at indicated times after transfer. (C) VPD staining from mice in A gated on CD45.1+ transferred cells. (D) Proportion of VPD undiluted cells among transferred cells. (E) Proportion of CD11c+CD11b+ ABCs among transferred cells. (F) Proportion of CD44+CD138+ PBs among transferred cells. (G) Proportion of PNA+CD38low GC B cells among transferred cells. Data are pooled from five independent sorts/transfers with 3–4 experiments per timepoint. Statistical comparisons by two-tailed Mann-Whitney; *P < 0.05; **P < 0.01; ***P < 0.001.
Figure 6.
Figure 6.
Constitutive genetic depletion of CD11c+ B cells improves renal disease and reduces T cell activation (A) Mixed bone marrow chimeras were generated in JH−/− MRL/lpr recipients with indicated bone marrow. Data are pooled from three independently generated cohorts of chimeras. (B–S) Recipients were assessed at 24 wk after chimerism for (B) spleen weight; (C) spleen cell number; proportion of (D) CD11c+MHCII+ conventional dendritic cells of live, (E) CD317+ SiglecH+ plasmacytoid dendritic cells of live, (F) TCRβ+ T cells of live, (G) CD19+ B cells of live, (H) CD11c CD11b+ ABCs among B cells, (I) CD11c+CD11b+ ABCs among B cells, (J) CD11c+CD11b ABCs among B cells, (K) CD44+ CD138+ PBs among B cells. (L–M) H&E-stained kidney sections were assessed for (L) interstitial infiltrates and (M) glomerulonephritis. (N) Urine was assessed for proteinuria by albustix. (O and P) Frequency of CD44lowCD62L+ (naive) cells among (O) CD4 T cells or (P) CD8 T cells. (Q) anti-nucleosome IgG, (R) anti-nucleosome IgG2a, and (S) anti-RNA IgG were measured by ELISA. Statistical comparisons by one-tailed Mann-Whitney; *P < 0.05; **P < 0.01; ***P < 0.001; ****P < 0.0001.
Figure S2.
Figure S2.
Constitutive deletion of CD11c+ B cells in bone marrow chimeras. (A) The extent to which the R26-DTA donor contributed to indicated subsets in recipient mice at 24 wk after chimerism was assessed by flow cytometry for presence of GFP in CD11c-Cre (up-facing triangles) and CD11c-Cre+ mice (down-facing triangles). Data are pooled from males and females across all cohorts. (B–F) Proportion of (B) CD23+CD21/35 FO or (C) CD21/35+CD23 MZ B cells of CD19+ cells or (D) CD4+, (E) CD8+, or (F) CD4CD8 (DN) cells among TCRβ+ T cells. (G and H) Total IgM (G) and total IgG (H) were measured by ELISA.
Figure S3.
Figure S3.
Isolation and characterization of CD19+ MRL/lpr B cells by scRNA-seq. (A) CD19+ TCRβ sort gates are indicated. Sorted B cells were stained with oligo-tagged sample hashing and surface feature antibodies prior to being pooled and processed via the 10× Chromium Next GEM Single Cell V(D)J v1.1 protocol per the manufacturer’s instructions. (B) Purple dots indicate contribution of cells from each donor mouse to the overall clustering UMAP. (C) A separate aliquot of total splenocytes from the same mice in A were stained with the indicated markers for conventional flow cytometry. (D) Summary of the contribution of each mouse to the clusters in Fig. 7 A as determined by the sample-hashing oligo-tagged anti-CD45/anti-β2m antibodies included in the surface feature library. (E) Expression of Itgam (CD11b), Itgax (CD11c), Spn (CD43), and Cd5 genes overlaid on the cluster UMAP. (F) Expression of CITE-seq mapped surface markers in scRNA-seq. Pairwise plots of normalized counts from oligo-tagged surface feature antibodies for B cell clusters not included in Fig. 7 C.
Figure 7.
Figure 7.
scRNA-seq identifies multiple ABC-like clusters. (A) WNN clustering was performed on CD19+ B cells from 18-wk MRL/lpr females using Seurat 4.0.0 on the basis of gene expression and surface feature libraries. Expression of cell cycle–related gene signatures is shown (top right). Normalized expression of indicated genes is shown (middle and bottom rows). (B) Cluster size, frequency as a percentage of total, and annotations are indicated. (C) Pairwise plots of normalized counts from the oligo-tagged surface feature antibody library for ABC clusters 4, 5, and 6 are shown. Plots for other clusters are available in Fig. S3. (D) Volcano plot of DEGs between ABC-like clusters 4 and 5 showing 335 genes with log2(fold change) >0.1 and false discovery rate < 0.05.
Figure S4.
Figure S4.
DEGs in scRNA-seq clusters. Heatmap showing z-scored expression of the top 10 most differentially expressed genes per cluster. Clusters are grouped based on unbiased hierarchical clustering.
Figure 8.
Figure 8.
ABCs and PBs share related expanded B cell clones with similar mutational burden. (A) Proportion of cells in each cluster with the indicated heavy chain isotype, based on 5′ VDJ library sequencing. (B) Normalized clonal overlap for indicated B cell subsets. Italicized numbers along diagonals indicate number of identified unique clones in each subset. Off-diagonal numbers indicate the number of overlapping clones between the subsets in the row and the column. Color of each box indicates the Jaccard similarity coefficient for each row and column. (C) Simpson’s diversity index was calculated for the indicated subsets from each of the three donor mice. (D) For each clone, the mean number of mutations per V segment was determined for each subset as indicated. The mean of the distribution for each subset is indicated by vertical dotted lines. Note that for clarity, only clones with at most 4% mutation frequency are included; for distributions including the full range of mutation frequency, see Fig. S5. (E) Mean number of mutations per V segment was compared for clones that were detected in both ABC and PB subsets. (F) Largest B cell lineage trees in each mouse. Horizontal distance indicates mutations per codon between tree nodes (see scale bar). Shape indicates annotated subset for each tip, while symbol color indicates Ig isotype. A few examples of identical clones in ABC and PB subsets are highlighted with red dotted circles; a few examples of an ABC with more mutations than a related PB are indicated by red arrows.
Figure S5.
Figure S5.
Mutation frequency in MRL B cell subsets. (A) Distribution of mean number of mutations per V segment for each subset. (B) Distribution of mean number of mutations per V segment for each cluster.

References

    1. Aranburu, A., Höök N., Gerasimcik N., Corleis B., Ren W., Camponeschi A., Carlsten H., Grimsholm O., and Mårtensson I.L.. 2018. Age-associated B cells expanded in autoimmune mice are memory cells sharing H-CDR3-selected repertoires. Eur. J. Immunol. 48:509–521. 10.1002/eji.201747127 - DOI - PubMed
    1. Atisha-Fregoso, Y., Toz B., and Diamond B.. 2021. Meant to B: B cells as a therapeutic target in systemic lupus erythematosus. J. Clin. Invest. 131:e149095. 10.1172/JCI149095 - DOI - PMC - PubMed
    1. Butler, A., Hoffman P., Smibert P., Papalexi E., and Satija R.. 2018. Integrating single-cell transcriptomic data across different conditions, technologies, and species. Nat. Biotechnol. 36:411–420. 10.1038/nbt.4096 - DOI - PMC - PubMed
    1. Cancro, M.P. 2020. Age-associated B cells. Annu. Rev. Immunol. 38:315–340. 10.1146/annurev-immunol-092419-031130 - DOI - PubMed
    1. Chan, O.T., Madaio M.P., and Shlomchik M.J.. 1999. B cells are required for lupus nephritis in the polygenic, Fas-intact MRL model of systemic autoimmunity. J. Immunol. 163:3592–3596. 10.4049/jimmunol.163.7.3592 - DOI - PubMed

Publication types