. 2023 Mar 8;145(9):4946-4950.
doi: 10.1021/jacs.2c12733. Epub 2023 Feb 24.

Active Nuclear Import of Mammalian Cell-Expressible DNA Origami

Affiliations

Active Nuclear Import of Mammalian Cell-Expressible DNA Origami

Anna Liedl et al. J Am Chem Soc. .

Abstract

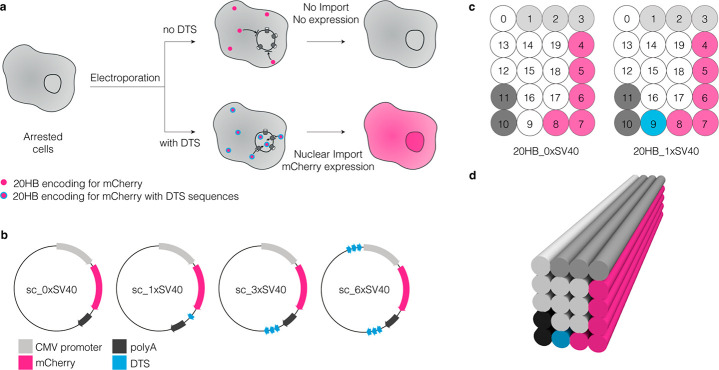
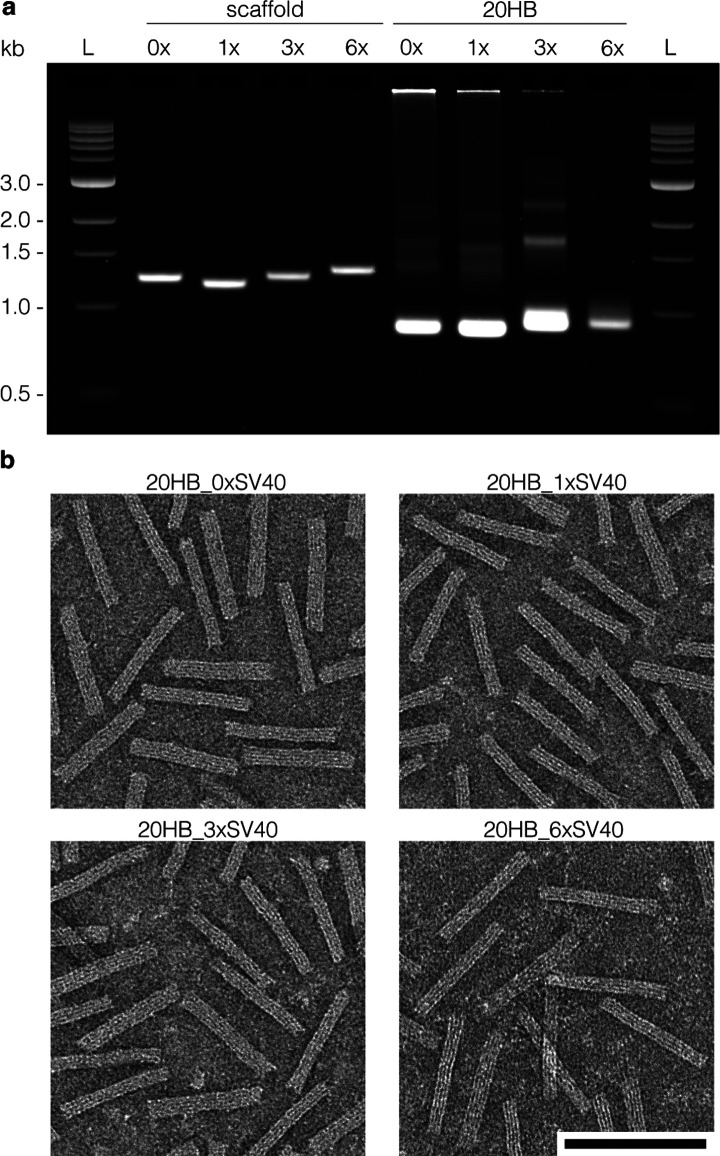
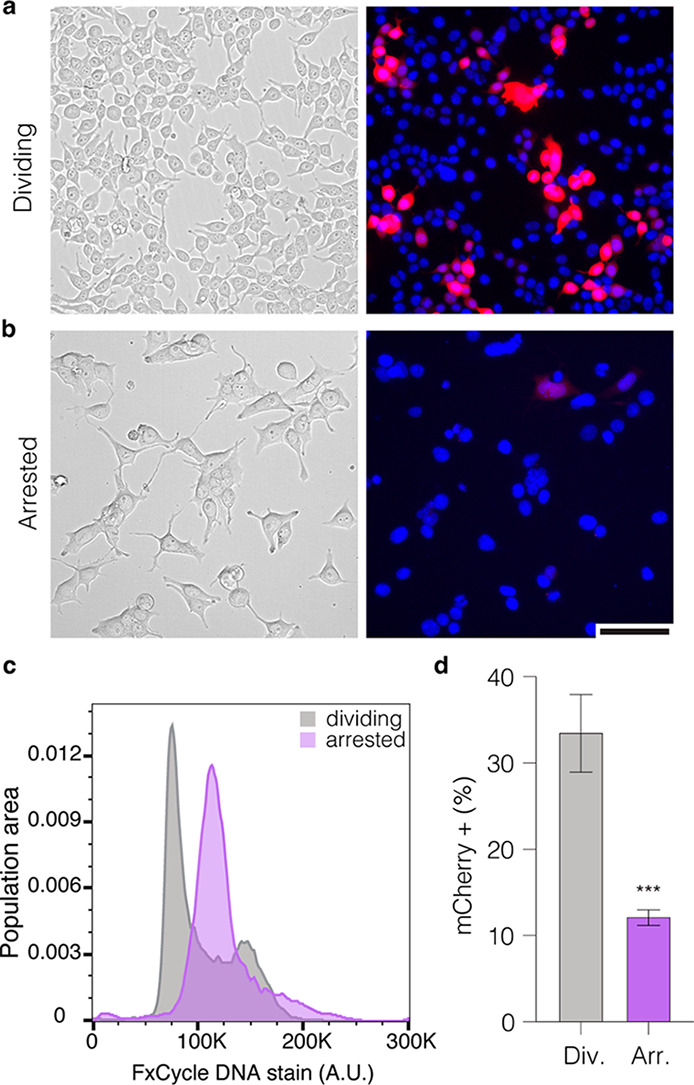
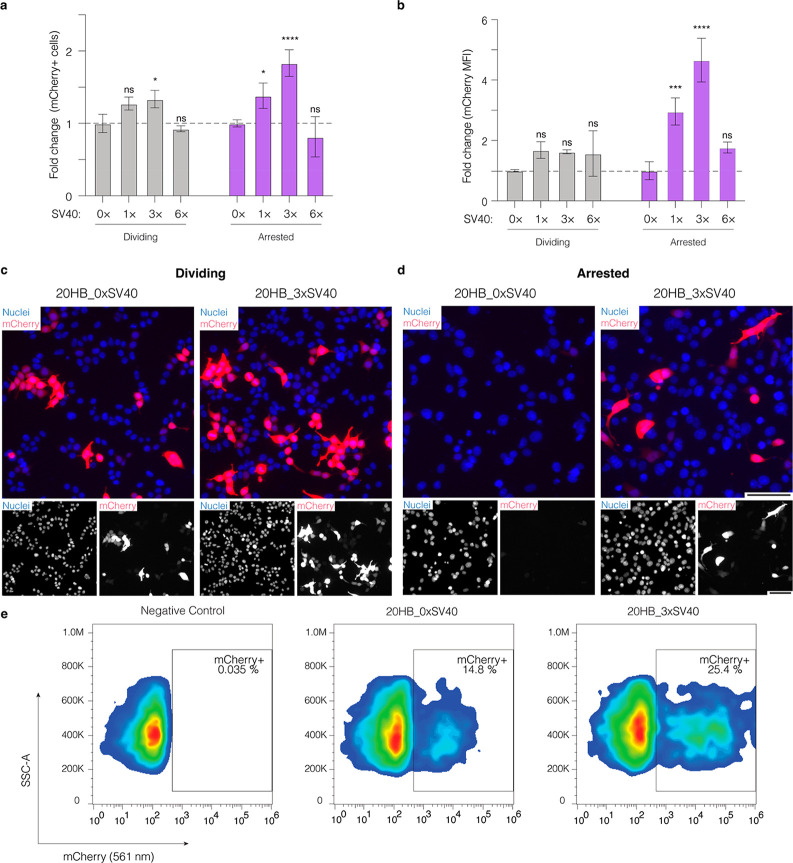
DNA origami enables the creation of complex 3D shapes from genetic material. Future uses could include the delivery of genetic instructions to cells, but nuclear import remains a major barrier to gene delivery due to the impermeability of the nuclear membrane. Here we realize active nuclear import of DNA origami objects in dividing and chemically arrested mammalian cells. We developed a custom DNA origami single-strand scaffold featuring a mammalian-cell expressible reporter gene (mCherry) and multiple Simian virus 40 (SV40) derived DNA nuclear targeting sequences (DTS). Inclusion of the DTS within DNA origami rescued gene expression in arrested cells, indicating that active transport into the nucleus occurs. Our work successfully adapts mechanisms known from viruses to promote the cellular expression of genetic instructions encoded within DNA origami objects.


Conflict of interest statement

The authors declare the following competing financial interest(s): A patent has been filed by TUM.

Figures

Figure 1
Figure 1
Engineering nuclear localization signals into custom DNA origami scaffolds and structures. (a) Electroporation enables delivery of DNA origami directly to the cytoplasm. Cellular recognition of DTS sequences should enhance nuclear uptake and thus expression of mCherry in nondividing cells, which are modeled here using a chemically arrested cell model. (b) Plasmid designs with varying numbers of SV40 DTS sequences included (0×, 1×, 3×, and 6×SV40 repeats) for production of custom ssDNA scaffolds. (c) Schematic cross section of helices (0–19) for the 20HB structures displaying sequences of interest in the exterior helices. (d) Cylindrical model of the used DNA origami structure, a 20-helix bundle (20HB). The colored regions in (b), (c), and (d) display the gene encoded on the scaffold part in the respective helix.
Figure 2
Figure 2
Characterization of custom scaffolds and corresponding DNA origami structures. (a) Agarose gel demonstrating all custom scaffolds produced, and the corresponding purified DNA origami structures. (b) Representative negative stain TEM images showing the 20HB DNA origami structures for each of the custom scaffolds produced. Scale bar 100 nm, ladder (L) depicts NEB 1 kb dsDNA ladder.
Figure 3
Figure 3
Cell cycle arrest diminishes gene delivery efficiency. Representative phase image and corresponding epifluorescence image of dividing (a) and arrested (b) HEK293T cells 24 h after electroporation with the 20HB_0×SV40 (without any SV40 sequences). mCherry signal is shown in red, nuclei in blue, scale bar 100 μm. (c) Flow cytometry histogram plot demonstrating cell cycle populations of actively dividing and chemically arrested HEK293T cells. (d) Quantification of mCherry+ cells (%) in dividing and chemically arrested HEK293T populations 24 h after electroporation with the 20HB_0×SV40. Data collected in (d) were quantified using flow cytometry and are presented as mean ± standard deviation (s.d.) for n = 3 biologically independent experiments. Statistical analysis for (d) was performed using Student’s t test (***p ≤ 0.001).
Figure 4
Figure 4
Presence of SV40 DTS sequences in DNA origami enhances gene expression through nuclear import. (a) Fold change of the percentage of mCherry+ cells and (b) mean fluorescence intensity (MFI) of mCherry in dividing and arrested cells after electroporation with 20HB variants. Both the percentage of mCherry positive cells and MFI are shown as fold change compared to the value of the control 20HB_0×SV40 in dividing and arrested cells, respectively. Data collected in (a) and (b) were quantified using flow cytometry and are presented as mean ± standard deviation (s.d.) for n = 3 biologically independent experiments. Statistical analysis was performed using two-way ANOVA with Dunnett’s multiple comparisons (*p ≤ 0.05, ***p ≤ 0.001, ****p ≤ 0.0001, ns p > 0.05). Representative epifluorescence microscopy images after electroporation of dividing cells (c) and arrested cells (d) for the control 20HB_0×SV40 and 20HB_3×SV40. Images were taken 24 h after electroporation and are representative of n = 3 biological replicates (similar results were observed each time); the full panel including all conditions is given in Figure S7. In overlay, mCherry signal is shown in red, nuclei are shown in blue. Scale bar is 100 μm. (e) Representative flow cytometry gates demonstrating mCherry expression (mCherry 561 nm, x-axis) against side scatter-area (SSC-A, y-axis) in chemically arrested HEK293T cells.

References

    1. Paunovska K.; Loughrey D.; Dahlman J. E. Drug Delivery Systems for RNA Therapeutics. Nat. Rev. Genet 2022, 23 (5), 265–280. 10.1038/s41576-021-00439-4. - DOI - PMC - PubMed
    1. Bulcha J. T.; Wang Y.; Ma H.; Tai P. W. L.; Gao G. Viral Vector Platforms within the Gene Therapy Landscape. Sig Transduct Target Ther 2021, 6 (1), 1–24. 10.1038/s41392-021-00487-6. - DOI - PMC - PubMed
    1. Roberts T. C.; Langer R.; Wood M. J. A. Advances in Oligonucleotide Drug Delivery. Nat. Rev. Drug Discov 2020, 19 (10), 673–694. 10.1038/s41573-020-0075-7. - DOI - PMC - PubMed
    1. Mastrobattista E.; van der Aa M. A. E. M.; Hennink W. E.; Crommelin D. J. A. Artificial Viruses: A Nanotechnological Approach to Gene Delivery. Nat. Rev. Drug Discov 2006, 5 (2), 115–121. 10.1038/nrd1960. - DOI - PubMed
    1. Douglas S. M.; Dietz H.; Liedl T.; Högberg B.; Graf F.; Shih W. M. Self-Assembly of DNA into Nanoscale Three-Dimensional Shapes. Nature 2009, 459 (7245), 414–418. 10.1038/nature08016. - DOI - PMC - PubMed

Publication types