

The COVID-19 Mortality Rate Is Associated with Illiteracy, Age, and Air Pollution in Urban Neighborhoods: A Spatiotemporal Cross-Sectional Analysis
- PMID: 36828501
- PMCID: PMC9962969
- DOI: 10.3390/tropicalmed8020085
The COVID-19 Mortality Rate Is Associated with Illiteracy, Age, and Air Pollution in Urban Neighborhoods: A Spatiotemporal Cross-Sectional Analysis
Abstract
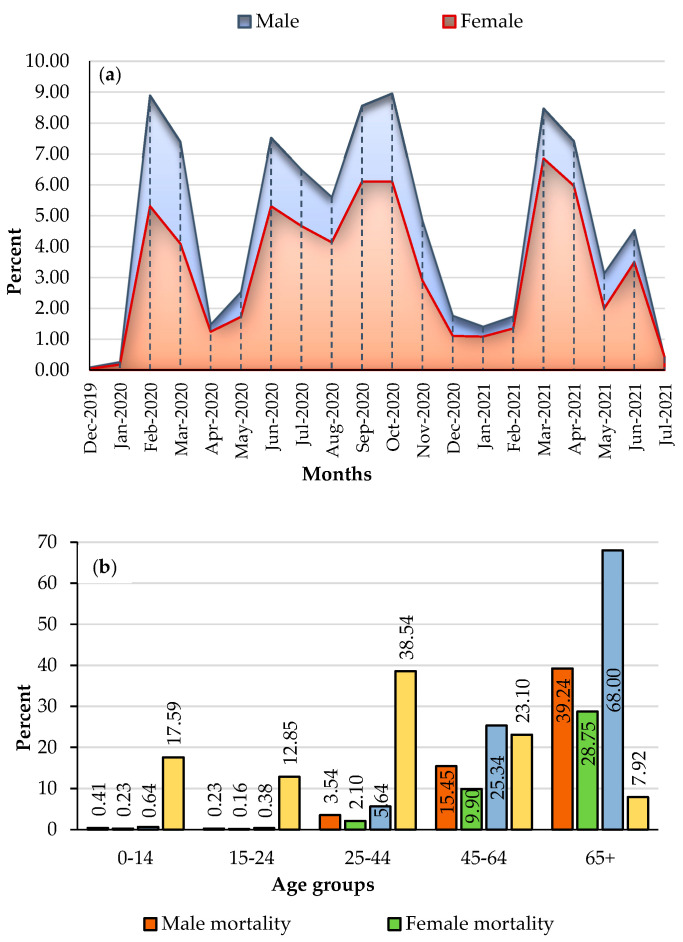
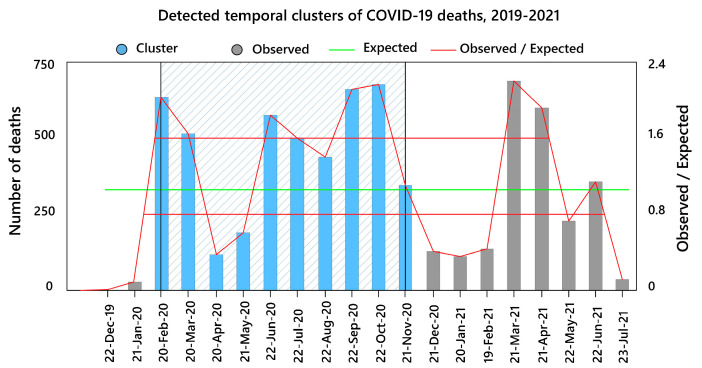
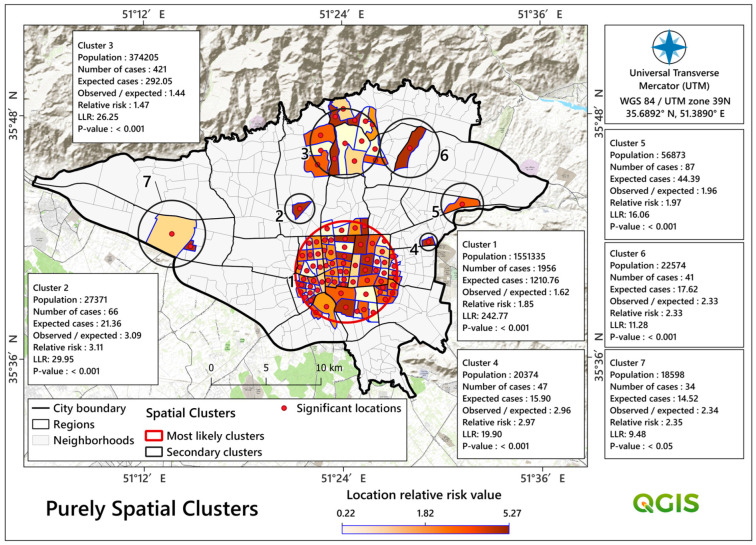
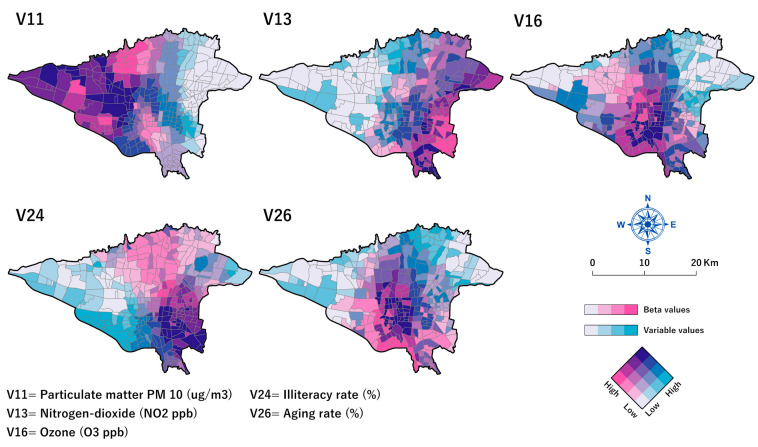
There are different area-based factors affecting the COVID-19 mortality rate in urban areas. This research aims to examine COVID-19 mortality rates and their geographical association with various socioeconomic and ecological determinants in 350 of Tehran's neighborhoods as a big city. All deaths related to COVID-19 are included from December 2019 to July 2021. Spatial techniques, such as Kulldorff's SatScan, geographically weighted regression (GWR), and multi-scale GWR (MGWR), were used to investigate the spatially varying correlations between COVID-19 mortality rates and predictors, including air pollutant factors, socioeconomic status, built environment factors, and public transportation infrastructure. The city's downtown and northern areas were found to be significantly clustered in terms of spatial and temporal high-risk areas for COVID-19 mortality. The MGWR regression model outperformed the OLS and GWR regression models with an adjusted R2 of 0.67. Furthermore, the mortality rate was found to be associated with air quality (e.g., NO2, PM10, and O3); as air pollution increased, so did mortality. Additionally, the aging and illiteracy rates of urban neighborhoods were positively associated with COVID-19 mortality rates. Our approach in this study could be implemented to study potential associations of area-based factors with other emerging infectious diseases worldwide.
Keywords: COVID-19 mortality; air pollution; air quality; determinants; socio-economic; spatiotemporal analysis.
Conflict of interest statement
The authors declare no conflict of interest.
Figures


Similar articles
-
How Did Distribution Patterns of Particulate Matter Air Pollution (PM2.5 and PM10) Change in China during the COVID-19 Outbreak: A Spatiotemporal Investigation at Chinese City-Level.Int J Environ Res Public Health. 2020 Aug 28;17(17):6274. doi: 10.3390/ijerph17176274. Int J Environ Res Public Health. 2020. PMID: 32872261 Free PMC article.
-
Homicide rates are spatially associated with built environment and socio-economic factors: a study in the neighbourhoods of Toronto, Canada.BMC Public Health. 2022 Aug 4;22(1):1482. doi: 10.1186/s12889-022-13807-4. BMC Public Health. 2022. PMID: 35927698 Free PMC article.
-
Effects of short-term exposure to air pollution on hospital admissions of young children for acute lower respiratory infections in Ho Chi Minh City, Vietnam.Res Rep Health Eff Inst. 2012 Jun;(169):5-72; discussion 73-83. Res Rep Health Eff Inst. 2012. PMID: 22849236
-
Social Susceptibility to Multiple Air Pollutants in Cardiovascular Disease.Res Rep Health Eff Inst. 2021 Jul;2021(206):1-71. Res Rep Health Eff Inst. 2021. PMID: 36004603 Free PMC article.
-
Acute and chronic exposure to air pollution in relation with incidence, prevalence, severity and mortality of COVID-19: a rapid systematic review.Environ Health. 2021 Apr 10;20(1):41. doi: 10.1186/s12940-021-00714-1. Environ Health. 2021. PMID: 33838685 Free PMC article.
Cited by
-
Spatial Autocorrelation of COVID-19 in Slovakia.Trop Med Infect Dis. 2023 May 30;8(6):298. doi: 10.3390/tropicalmed8060298. Trop Med Infect Dis. 2023. PMID: 37368716 Free PMC article.
-
Spatio-temporal clustering analysis of COVID-19 cases in Johor.Infect Dis Model. 2024 Feb 8;9(2):387-396. doi: 10.1016/j.idm.2024.01.009. eCollection 2024 Jun. Infect Dis Model. 2024. PMID: 38385018 Free PMC article.
-
Public health impacts of air pollution from the spatiotemporal heterogeneity perspective: 31 provinces and municipalities in China from 2013 to 2020.Front Public Health. 2024 Aug 2;12:1422505. doi: 10.3389/fpubh.2024.1422505. eCollection 2024. Front Public Health. 2024. PMID: 39157526 Free PMC article.
-
Multiscale Geographically Weighted Regression in the Investigation of Local COVID-19 Anomalies Based on Population Age Structure in Poland.Int J Environ Res Public Health. 2023 May 19;20(10):5875. doi: 10.3390/ijerph20105875. Int J Environ Res Public Health. 2023. PMID: 37239602 Free PMC article.
-
Spatiotemporal clusters of acute respiratory infections associated with socioeconomic, meteorological, and air pollution factors in South Punjab, Pakistan.BMC Public Health. 2025 Feb 5;25(1):469. doi: 10.1186/s12889-025-21741-4. BMC Public Health. 2025. PMID: 39910401 Free PMC article.
References
-
- World Health Organization (WHO) WHO Coronavirus (COVID-19) Dashboard. 2022. [(accessed on 20 January 2023)]. Available online: https://covid19.who.int/
-
- World Health Organization (WHO) COVID-19 Updates, Islamic Republic of Iran. 2022. [(accessed on 10 January 2023)]. Available online: http://www.emro.who.int/images/stories/iran/covid-19-sit-reps/COVID-19-U....
-
- World Health Organization (WHO) Response to COVID-19 in Iran. 2022. [(accessed on 24 December 2022)]. Available online: https://www.who.int/about/accountability/results/who-results-report-2020....
-
- Iran Ministry of Health and Medical Education (MOHME) COVID-19 Cases and Deaths in the Cities of Iran. [(accessed on 1 November 2019)]; Available online: https://behdasht.gov.ir/.
Grants and funding
LinkOut - more resources
Full Text Sources
