. 2023 Feb 24;14(1):1069.
doi: 10.1038/s41467-023-36678-8.

Multitrait genome-wide analyses identify new susceptibility loci and candidate drugs to primary sclerosing cholangitis

Collaborators, Affiliations

Multitrait genome-wide analyses identify new susceptibility loci and candidate drugs to primary sclerosing cholangitis

Younghun Han et al. Nat Commun. .

Abstract

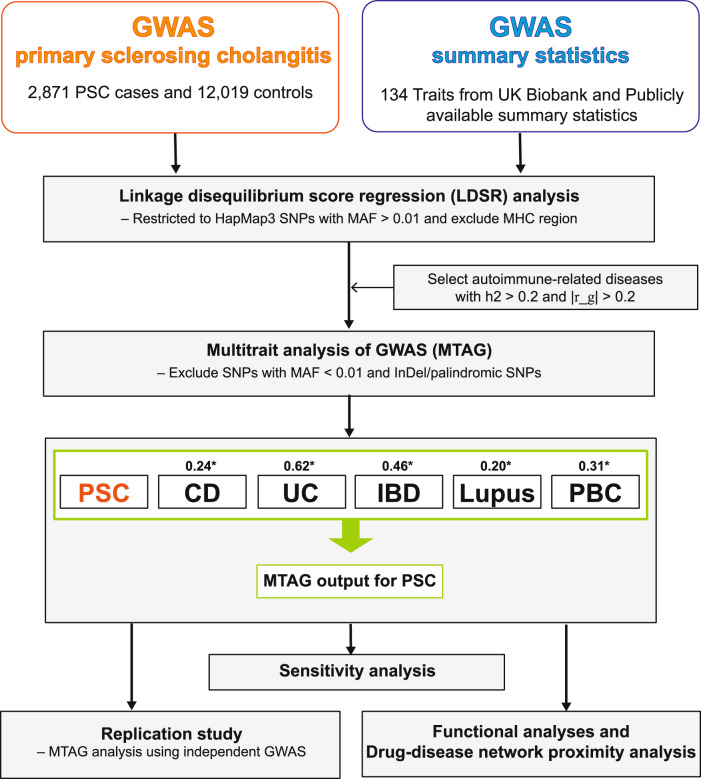
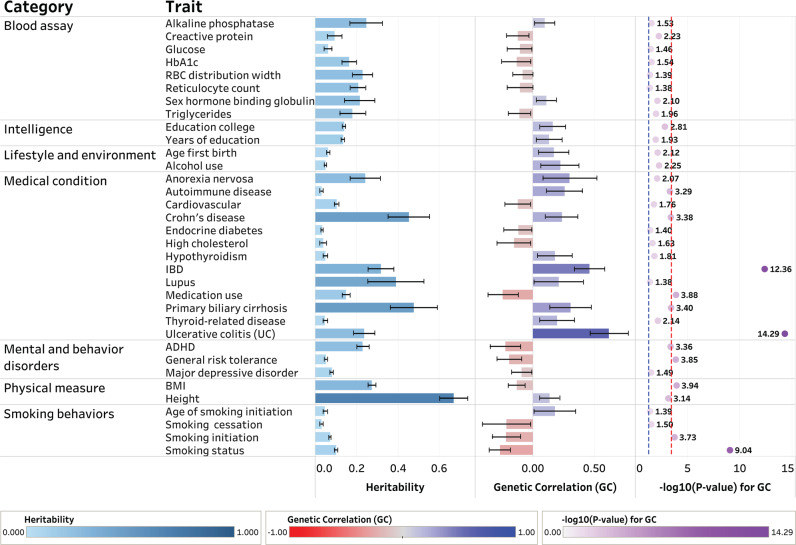
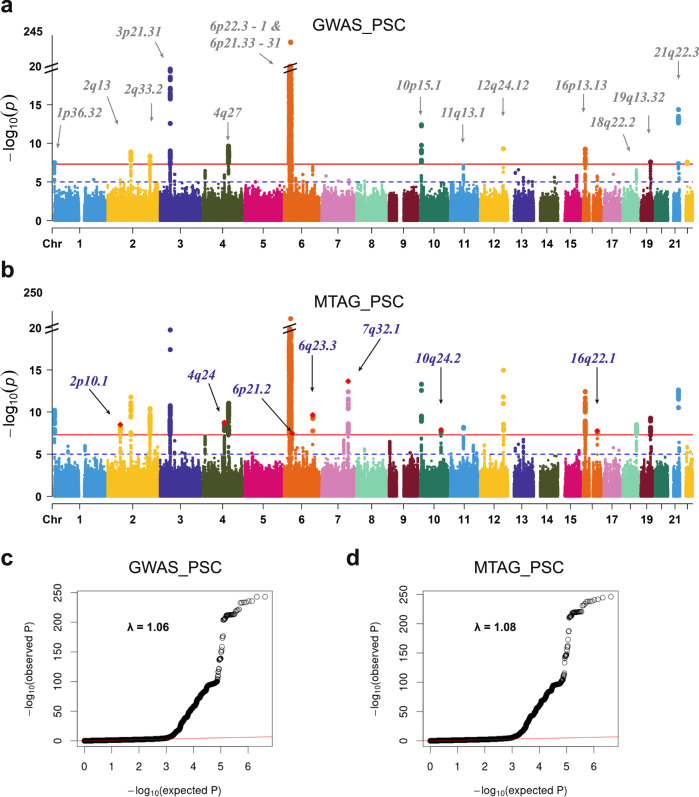
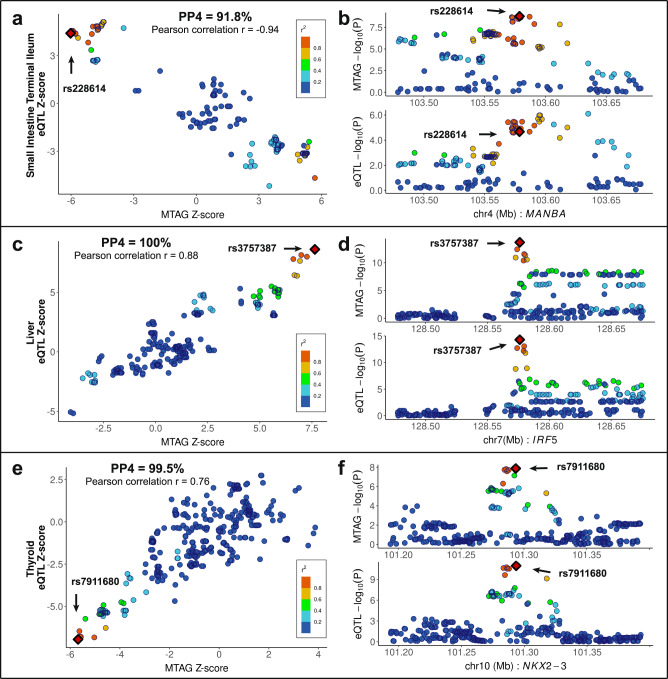
Primary sclerosing cholangitis (PSC) is a rare autoimmune bile duct disease that is strongly associated with immune-mediated disorders. In this study, we implemented multitrait joint analyses to genome-wide association summary statistics of PSC and numerous clinical and epidemiological traits to estimate the genetic contribution of each trait and genetic correlations between traits and to identify new lead PSC risk-associated loci. We identified seven new loci that have not been previously reported and one new independent lead variant in the previously reported locus. Functional annotation and fine-mapping nominated several potential susceptibility genes such as MANBA and IRF5. Network-based in silico drug efficacy screening provided candidate agents for further study of pharmacological effect in PSC.


Conflict of interest statement

The authors declare no competing interests.

Figures

Fig. 1
Fig. 1. Flow chart of the analytical workflow in this study.
h2 represents SNP-based heritability in the observed scale. |r_g| represents the absolute value of the pairwise genetic correlation between PSC and the traits studied. MAF stands for a minor allele frequency. MHC region stands for the major histocompatibility complex region. The asterisk “*” indicates the genetic correlation between PSC and each tested trait. The imputed summary statistics for PBC were used for subsequent analyses.
Fig. 2
Fig. 2. The shared heritability and genetic correlation of PSC among clinical and epidemiological traits.
The dotted lines in blue and red indicate nominally and Bonferroni-corrected significant levels of log100.05=1.30 and log103.73×104=3.43, respectively. The error bar represents 95% confidence interval for the estimate of SNP-based heritability and pairwise genetic correlation of PSC in each trait, respectively. Sample sizes used to derive the estimates of SNP-based heritability and pairwise genetic correlation of PSC in each trait are shown in Supplementary Data 1. The dashboard for visualizing the results from LDSR was created using Tableau Desktop software (version 2022.2).
Fig. 3
Fig. 3. Manhattan plots and quantile-quantile plots for the single-trait GWAS and the multitrait GWAS of PSC.
a, c PSC single-trait GWAS (Ji et al., 2017, PMID:27992413; GWAS_PSC). b, d MTAG-identified PSC-specific GWAS against five immune-mediated disorders, CD, UC, IBD, lupus, and PBC (MTAG_PSC). The x-axis represents chromosomal location, and the y-axis represents the −log10(P-value). The cytoband annotations for the newly and previously identified loci are in purple (b) and gray (a), respectively. The solid lines in red and the dotted lines in blue indicate the genome-wide significant two-sided unadjusted P-value of log10(5×10⁸) and the suggestive significant two-sided unadjusted P-value of log10(1×10⁵), respectively. P-values are derived using multitrait analysis of GWAS in the discovery study.
Fig. 4
Fig. 4. Functional validation of the MTAG-identified PSC-specific candidate genes.
a, c, e eQTL signals in GTEx v8 small intestine terminal ileum (n = 174) for MANBA (a), liver (n = 208) for IRF5 (c), and thyroid (n = 574) for NKX2-3 (e) colocalize with those of the MTAG-identified PSC-specific GWAS by coloc (posterior probability for the same causal variant shared between MTAG-identified GWAS and a tissue-specific eQTL (PP4) = 0.918 for rs228614, PP4 = 1.00 for rs3757387, and PP4 = 0.995 for rs7911680), respectively. Pearson correlation (r) is shown between the Z-score of eQTL (y-axis) and MTAG_PSC (x-axis). Variants are color-coded based on the LD r2 (1000 Genomes phase 3, EUR) with the candidate variants (red dot in a diamond shape). Variants with imputation quality scores >0.6 were plotted in this region. b, d, f Regional association plots of eQTL and MTAG_PSC within ±100kb of rs228614 (b), rs3757387 (d), and rs7911680 (f) are displayed.

Similar articles

Cited by

References

    1. Karlsen TH, Schrumpf E, Boberg KM. Primary sclerosing cholangitis. Best. Pr. Res. Clin. Gastroenterol. 2010;24:655–666. doi: 10.1016/j.bpg.2010.07.005. - DOI - PubMed
    1. Ji SG, et al. Genome-wide association study of primary sclerosing cholangitis identifies new risk loci and quantifies the genetic relationship with inflammatory bowel disease. Nat. Genet. 2017;49:269–273. doi: 10.1038/ng.3745. - DOI - PMC - PubMed
    1. Chung BK, Hirschfield GM. Immunogenetics in primary sclerosing cholangitis. Curr. Opin. Gastroenterol. 2017;33:93–98. doi: 10.1097/MOG.0000000000000336. - DOI - PubMed
    1. Blechacz B. Cholangiocarcinoma: current knowledge and new developments. Gut Liver. 2017;11:13–26. doi: 10.5009/gnl15568. - DOI - PMC - PubMed
    1. Melum E, et al. Genome-wide association analysis in primary sclerosing cholangitis identifies two non-HLA susceptibility loci. Nat. Genet. 2011;43:17–19. doi: 10.1038/ng.728. - DOI - PMC - PubMed

Publication types

Substances