. 2023 Feb 24;14(1):1066.
doi: 10.1038/s41467-023-36641-7.

An analgesic pathway from parvocellular oxytocin neurons to the periaqueductal gray in rats

Affiliations

An analgesic pathway from parvocellular oxytocin neurons to the periaqueductal gray in rats

Mai Iwasaki et al. Nat Commun. .

Abstract

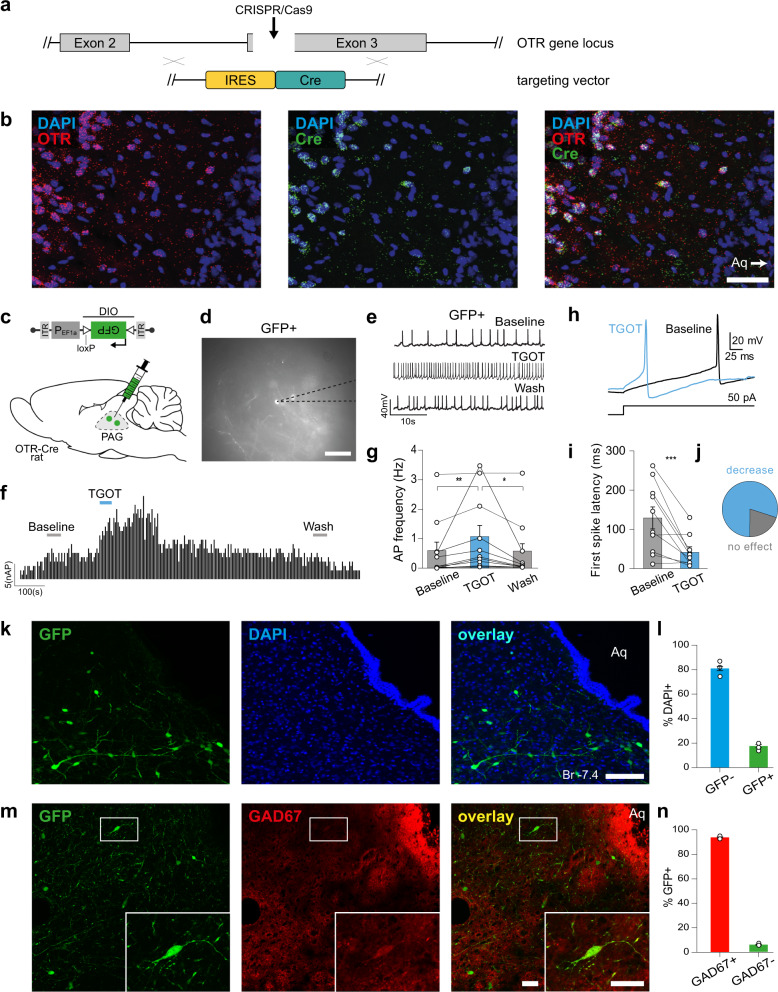
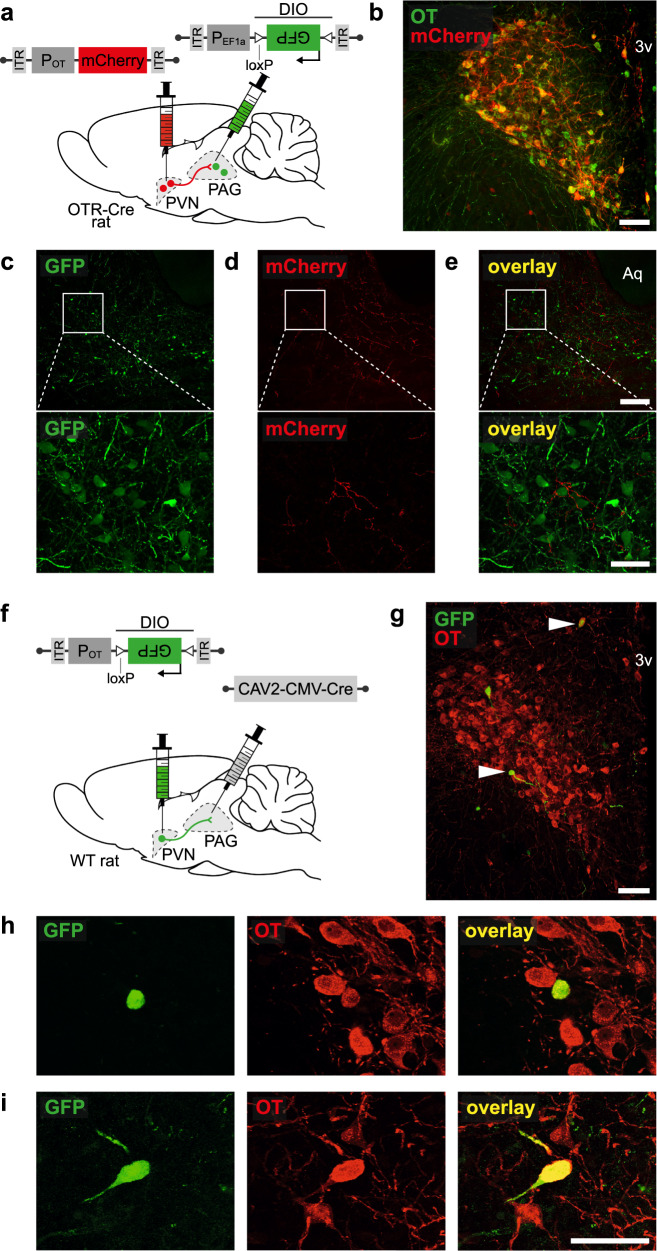
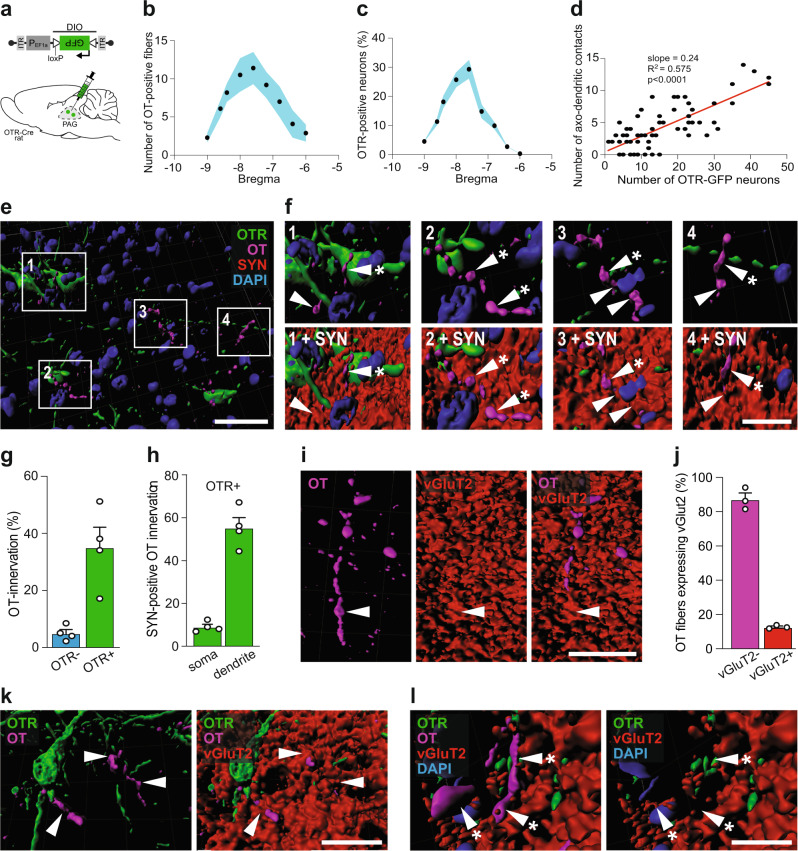
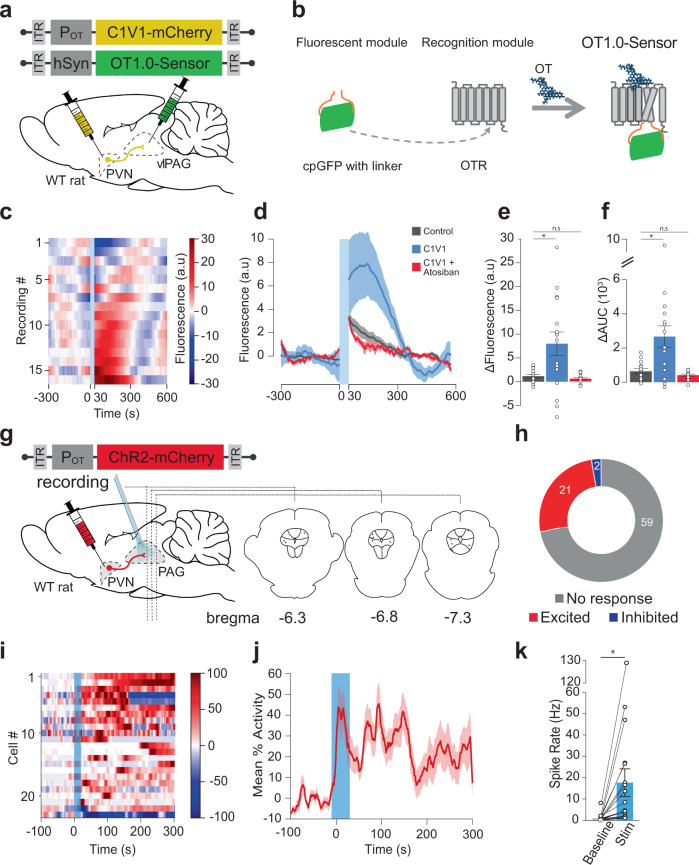
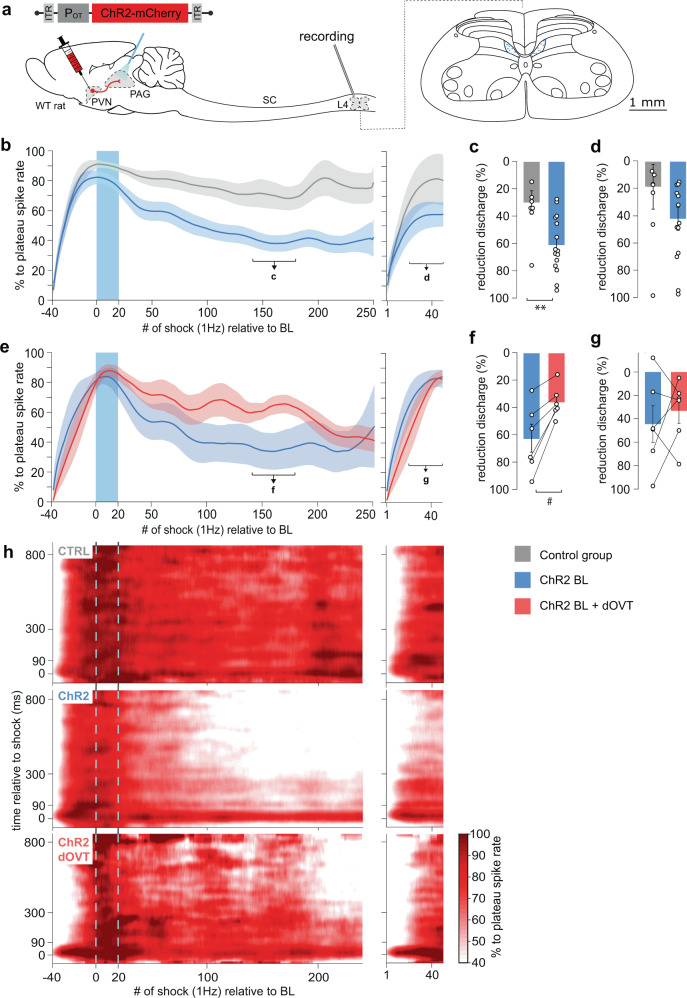
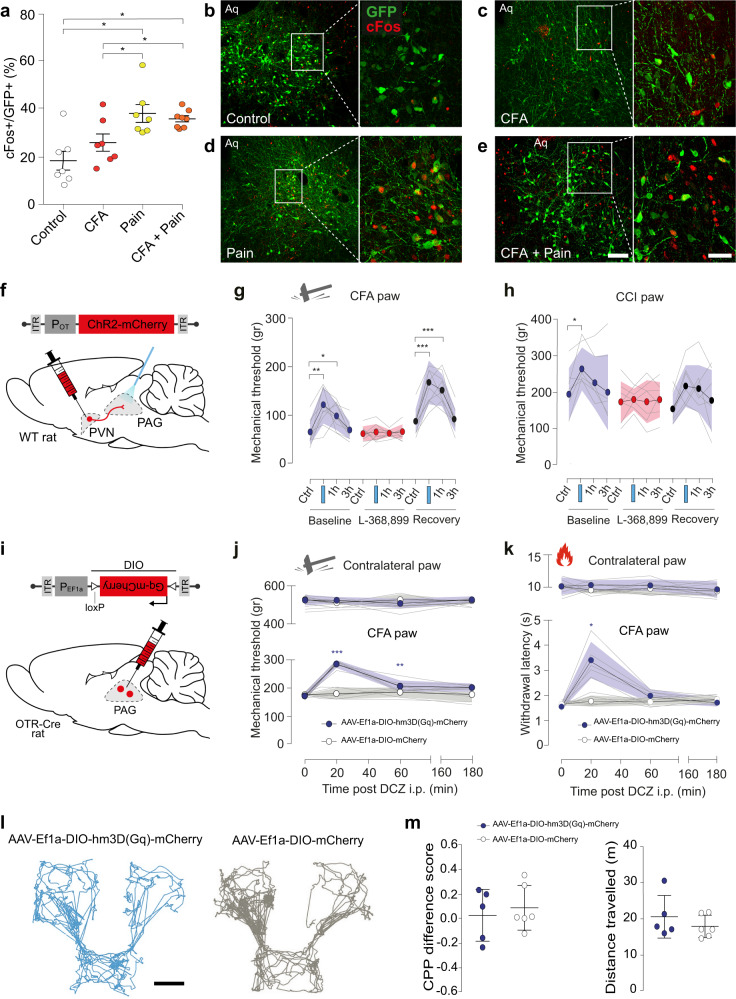
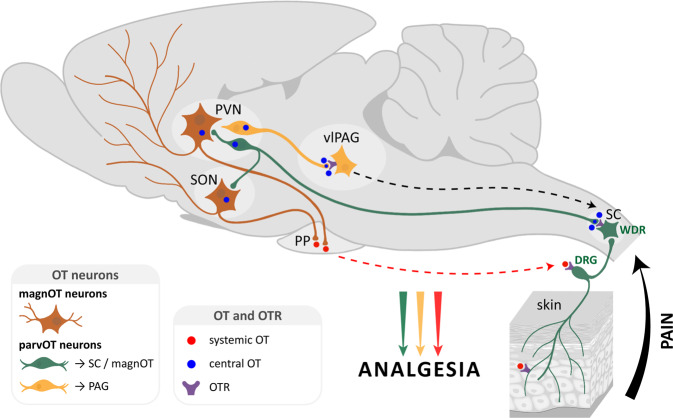
The hypothalamic neuropeptide oxytocin (OT) exerts prominent analgesic effects via central and peripheral action. However, the precise analgesic pathways recruited by OT are largely elusive. Here we discovered a subset of OT neurons whose projections preferentially terminate on OT receptor (OTR)-expressing neurons in the ventrolateral periaqueductal gray (vlPAG). Using a newly generated line of transgenic rats (OTR-IRES-Cre), we determined that most of the vlPAG OTR expressing cells targeted by OT projections are GABAergic. Ex vivo stimulation of parvocellular OT axons in the vlPAG induced local OT release, as measured with OT sensor GRAB. In vivo, optogenetically-evoked axonal OT release in the vlPAG of as well as chemogenetic activation of OTR vlPAG neurons resulted in a long-lasting increase of vlPAG neuronal activity. This lead to an indirect suppression of sensory neuron activity in the spinal cord and strong analgesia in both female and male rats. Altogether, we describe an OT-vlPAG-spinal cord circuit that is critical for analgesia in both inflammatory and neuropathic pain models.


Conflict of interest statement

The authors declare no competing interests.

Figures

Fig. 1
Fig. 1. Generation of KI OTR-Cre rats and identification of vlPAG OTR neurons.
a, b Generation of knock-in OTR-Cre rats; a Schema of the OTR gene locus and the insertion site of the IRES-Cre sequence. b RNA-scope in situ hybridization signal from Cre (ncells = 47 cells) and OTR (ncells = 42) probes. Scale bar = 200 µm. cg TGOT-induced increase of AP frequency of OTR neurons in the PAG of female rats. c Schema of rAAV1/2-pEF1α-DIO-GFP injection in the PAG of OTR-Cre rats. d Example image showing a GFP-positive cell during patch-clamp recordings. Scale bar = 20 µm. e Example traces from a GFP-positive cell under baseline, TGOT application, and wash out conditions. f Time course of GFP-positive cell activity (frequency distribution) upon TGOT application. g Quantification of TGOT effect on AP frequency of GFP-positive cells. Friedmann test, F = 14.97, p < 0.0001, ncells = 11, nrats = 4 followed by Dunn’s multiple corrections: Baseline 0.573 ± 0.295 Hz vs TGOT 1.045 ± 0.388 Hz vs Wash 0.514 ± 0.298 Hz; **p = 0.0029, *p = 0.0168 (two-sided). hj TGOT-induced change in first spike latency (FSL) of OTR neurons in the PAG. h Representative evoked currents in a GFP-positive neuron in response to a square current step (50 pA) in baseline (black line) and after TGOT application (blue line). i FSL quantification for GFP-positive neurons showing the difference between baseline (129.31 ± 28.04 ms) and TGOT (41.42 ± 12.37 ms) conditions, ***p = 0.0041 (paired two-tailed t test, ncells = 10, nrats = 4). j Proportion of neurons after TGOT incubation with a decrease of the FSL superior to 10 ms ((blue) n = 8/10) or with a variation of the FSL < 10 ms ((gray) n = 2/10). k, l Quantitative analysis of OTR cells in the PAG. k Images showing GFP (green) and DAPI (blue) staining of the vlPAG from OTR-Cre rats injected with rAAV1/2-pEF1α-DIO-GFP virus. Scale bar = 100 µm. Aq = Aqueduct. l Bar plot showing the percentage of vlPAG cells expressing GFP ± SEM (ncells = 417, nrats = 3). m, n GAD67 staining of OTR cells in the vlPAG. m Image of a vlPAG brain slice stained for GFP (green) and GAD67 (red). Scale bar = 100 µm, inset scale bar = 20 µm. n Bar plot showing the percentage of GFP-positive neurons ± SEM (ncells = 338, nrats = 2) in the vlPAG stained and not stained by GAD67 antibody. Data are represented as mean ± SEM and as individual paired points. Source data are provided as a Source data file.
Fig. 2
Fig. 2. PVN ParvOT neurons send axonal projections to vlPAG of female rats.
ae Anterograde tracing of projections from PVN OT-neurons to the vlPAG. a Schema of viral injection showing injection of rAAV1/2-pOT-mCherry in the PVN and rAAV1/2-pEF1α-DIO-GFP in the PAG of OTR-Cre rats (n = 4 female rats). b Image showing co-localization of rAAV1/2-pOT-mCherry and OT in the PVN. Scale bar = 200 µm. 3v = third ventricle. ce Images of GFP (green, c) and mCherry (red, d) staining in the vlPAG showing PVN OT fibers surrounding vlPAG GFP neurons (e). Scale bar = 300 µm, zoom scale bar = 40 µm. Aq = Aqueduct. fi Retrograde tracing of projections from PVN OT-neurons to the vlPAG. f Schema of viral injection showing injection of rAAV1/2-pOT-DIO-GFP in the PVN and rAAV1/2-CAV2-Cre in the vlPAG of WT rats (n = 4 female rats). g Image of the PVN from a rat injected with CAV2-Cre into the vlPAG and rAAV1/2-OTp-DIO-GFP into PVN, with OT stained in red. White arrows indicate co-localization of GFP and OT. Scale bar = 200 µm. h, i Magnified insets of the cells indicated by white arrows in the wide field image. Scale bar = 40 µm.
Fig. 3
Fig. 3. OT fibers form synaptic and non-synaptic contacts with vlPAG OTR neurons of female rats.
a Schema of rAAV1/2-pEF1α-DIO-GFP injection in the PAG of OTR-Cre rats. b Graph showing the relation between the number of OT fibers in the vlPAG and the bregma level. Blue area represents SEM. nfibers = 290, nrats = 4. c Graph showing the relation between the percentage of OTR neurons in the vlPAG and the bregma level. Blue area represents SEM. ncells = 528, nrats = 4. d Correlation between the numbers of OTR neurons and OT fibers within the same slice (nslice = 64). Each dot represents one analyzed brain section. Pearson r correlation, R2 = 0.5745, p < 0.0001 (two-sided), slope = 0.2438. e, f Three-dimensional reconstruction of OTergic contacts with vlPAG OTR neurons. e Overview image showing OTR-neurons (green), OT-fibers (magenta), synaptophysin (SYN, red), and DAPI (blue). f Magnified images showing contacts with or without SYN. White arrowheads indicate co-localization of OT (magenta) and SYN (red), while white arrowheads with an asterisk show a mismatch of OT and SYN. DAPI = blue, OTR = green. g Bar graph showing the percentage of OTR positive (n = 496) and negative (n = 3840) cells receiving OT innervation (<1 µm distance between fibers and cells). nrats = 4, 8 images per animal, p = 0.0055 (two-sided). h Bar graph showings the percentage of contacts between OT and OTR-positive neurons at somatic and dendritic locations. nrats = 4, 8 images per animal, p < 0.0001 (two-sided). i Reconstruction of a vGluT2-positive (red) OT fibers (magenta) within the vlPAG. j Bar graph showing that the vast majority of OT fibers within the vlPAG are vGluT2-negative (92.4%). n = 4. k, l 3D reconstruction of contacts between an OTR dendrite and OT fibers. k Co-localization of OT (magenta) and vGluT2 (red) are indicated by white arrowheads. l Mismatch of OT (magenta) and vGluT2 (red) are indicated by white arrowheads with an asterisk. DAPI = blue, OTR = green. n = 4 female rats. Scale bars in order of appearance: 50, 10, 10, 20, and 20 µm. Results are expressed as the mean ± SEM and the individual points of each conditions are represented as white circle. Source data are provided as a Source data file.
Fig. 4
Fig. 4. Endogenous OT release in the vlPAG increases vlPAG neuron activity in female rats.
a Schema of injections of rAAV1/2-pOT-C1V1-mCherry in the PVN and rAAV1/2-hSyn-OT1.0-sensor in the vlPAG. b Schema depicting the principle behind the GRABOT sensor. c Fluorescence signal of the C1V1 condition in the vlPAG (nrecordings = 16; nslices = 7; nrats = 3). Blue band at 0 s correspond to the yellow stimulation (30 ms pulse at 20 Hz for 30 s). d Mean fluorescence (line) ± SEM (shaded) of the control (gray), C1V1 (blue), and C1V1 + atosiban (red) recordings in the vlPAG. e Delta of the max fluorescence value between the period before the light stimulation (−300 to 0 s) and the period following the light stimulation (0 to 300 s). The delta of the three conditions are represented. Welch’s ANOVA test (W = 6.934, p = 0.0045, n = 16) followed by Dunnett’s T3 multiple comparison post hoc test (two-sided): Control vs C1V1: *padj = 0.0272; Control vs C1V1 + Atosiban: padj: = 0.3133. f Delta of the mean Area Under the Curve (AUC) between the period before the light stimulation (−300 to 0 s) and the period following the light stimulation (0 to 300 s). The delta of the three conditions are represented. Welch’s ANOVA test (W = 6.934, p = 0.0045, n = 16) followed by Dunnett’s T3 multiple comparison post hoc test (two-sided): Control vs C1V1: *padj = 0.0118; Control vs C1V1 + atosiban: padj: = 0.2939. g Schema of rAAV1/2-pOT-ChR2-mCherry injection in the PVN and setup for in vivo electrophysiological recordings (gray electrode), together with blue light (BL) stimulation (blue optic fiber) in the PAG. Recording site is shown on coronal drawings from anterior to posterior. h Recorded units’ responsiveness. i Normalized firing rate of each vlPAG neuron (ncells = 23; nrats = 12) that responded to BL in the vlPAG. 473 nm of BL was added as a 10 ms pulse at 30 Hz for 20 s, 100μW/mm². Dotted lines = BL stimulation. j Mean percent activity (line) ± SEM (shaded) calculated from panel (i). k Difference in mean firing rate between the period before BL (−100 to 0 s) and the maximum activity period following BL stimulation (highest value among moving means with a time window of 21 s, between 0 to +300 s after the start of BL). Paired t-test, *p = 0.0133 (two-sided), n = 17. Results are expressed as the mean ± SEM and the individual points of each conditions are represented as white circle. Source data are provided as a Source data file.
Fig. 5
Fig. 5. Endogenous OT release in vlPAG reduces WDR spinal cord neuronal activity in female rats.
a Schema of rAAV1/2-OTp-ChR2-mCherry injection in the PVN and setup for in vivo electrophysiological recordings (gray electrode) of WDR neurons in the rat spinal cord (SC) at the lumbar 4 (L4) level during optogenetic BL stimulation (blue optic fiber) in the vlPAG. Recording sites in layer 5 are shown in the coronal drawing of L4. bd vlPAG BL effect on the spike rate of WDR’s C-fiber discharge. b Mean time course observed after vlPAG BL in control rats (gray, ncells = 8; nrats = 4) and OT ChR2-expressing rats (blue, ncells = 14 nrats = 6). Left and right panels show two consecutive recordings separated by 300 s. Line shadows represent SEM. c Percentage of reduction expressed as the minimum level activity observed after a wind-up plateau phase, 140–180 s; Unpaired Wilcoxon rank sum test (two-sided); CTRL (ncells = 8) 30.12 ± 8.60 vs ChR2 (ncells = 14) 61.28 ± 5.37%, U = 18, p = 0.0053, and d 570–600 s after BL onset. Unpaired Wilcoxon rank sum test; CTRL (ncells = 8) 18.73 ± 16.45 vs ChR2 (ncells = 14) 42.23 ± 8.45%, U = 34, p = 0.1450. eg PAG OTR contribution to the vlPAG BL effect on the spike rate of WDR’s C-fiber discharge. e Mean time course observed after vlPAG BL in OT ChR2-expressing rats (blue, ncells = 6; nrats = 4), and in the same recordings after dOVT injection in the vlPAG (red, ncells = 6; nrats = 4). Left and right panels show two consecutive recordings separated by 300 s. Line shadows represent SEM. f Percentage of reduction expressed as the minimum level activity observed after a wind-up plateau phase, 140–180 s; Paired Wilcoxon signed-rank test (two-sided); ChR2 63.16 ± 10.07 vs dOVT 36.27 ± 4.8%, W = 0, #p = 0.0313, ncells = 6 and g 570–600 s after BL onset. Paired Wilcoxon signed-rank test; ChR2 44.51 ± 15.61 vs dOVT 33.16 ± 10.89%, W = 8, p = 0.6875, ncells = 6. h Mean smoothed raster plot of WDR discharge level along the relative timing to each single electric shock on the hind paw (vertical axis) and along the accumulating trials of electric shock (horizontal axis), in CTRL animals (top, n = 8), ChR2 animals (middle, n = 14), and ChR2 animals after dOVT injection in PAG (bottom, n = 6). Results are expressed as the mean ± SEM and the individual points of each conditions are represented as white circle. Source data are provided as a Source data file.
Fig. 6
Fig. 6. Evoked OT release in vlPAG reduces mechanical hyperalgesia.
a Percentage of c-Fos positive vlPAG OTR neurons under the control condition, painful stimulation, CFA inflammation, and painful stimulation combined with CFA. n = 7–8 per group, Kruskall Wallis test H = 12.01, p = 0.00733, CTRL vs pain, CTRL vs pain + CFA, CFA vs pain, CFA vs pain + CFA p < 0.05, CTRL vs CFA p > 0.05. be Examples of images showing c-Fos (red) and GFP (green) staining of vlPAG under the different experimental conditions (be). Scale bar = 200 µm, inset scale bar = 75 µm. Aq = aqueduct. f Schema of rAAV1/2-OTp-ChR2-mCherry injection in the PVN and optic fiber implantation in the PAG. g, h Threshold of mechanical pain-like behaviors was raised by PAG-BL. The effect of vlPAG-BL was measured at 5 min, 1 h, and 3 h after vlPAG-BL for: g the CFA-injected paw, 2-way RM ANOVA test (Finteraction = 9.555; p < 0.0001; nrats = 10), followed by multiple comparison post hoc test with Dunnett correction: Baseline Ctrl vs BL: **padj = 0.0019; Ctrl vs 1 h: *padj: = 0.0269; Recovery, Ctrl vs BL: ***padj = 0.0001: Ctrl vs 1 h: ***padj = 0.0005. h the CCI-treated paw, 2-way RM ANOVA test (Ftime = 6.452; p = 0.0012; nrats = 7), followed by multiple comparison post hoc test with Dunnett correction: Baseline Ctrl vs BL: *padj = 0.0363. i Schema of the injection of rAAV1/2-EF1α-DIO-Gq-mCherry in the PAG. j Mechanical pain threshold after DCZ administration in the CFA and contralateral paw of female rats expressing Gq-mCherry (blue) or mCherry only (gray) in vlPAG OTR neurons. 2-way RM ANOVA test (Finteraction = 21.41; p < 0.0001; nrats = 5–6), followed by multiple comparison post hoc test with Dunnett correction: Gq-mCherry, 0 vs 20: ***padj = 0.0006; 0 vs 60: **padj: = 0.0089. k Thermal pain threshold of female rats expressing Gq-mCherry (red) or mCherry only (gray) in vlPAG OTR neurons after DCZ administration during normal or inflammation (CFA) conditions. 2-way RM ANOVA test (Finteraction = 28.29; p < 0.0001; nrats = 5–6), followed by multiple comparison post hoc test with Dunnett correction: Gq-mCherry, 0 vs 20: *padj = 0.0108. l Representative activity traces during the CPP test. Scale bar = 20 cm. m Graphs showing the ΔCPP score (left) and total distance traveled (right) for the test and control groups. Unpaired t-test (two-sided): p = 0.6185 (left) and p = 0.3587 (right); n = 6 per group. All results are expressed as average ± SEM and individual animals are represented with the lines, or individual points represented as blue or white circle. Source data are provided as a Source data file.
Fig. 7
Fig. 7. Two distinct ParvOT neuronal populations promote analgesia via release of OT in the vlPAG and in the blood and spinal cord.
We hypothesize that two parallel parvOT pathways are activated by pathological, painful stimuli. Both pathways release OT in various brain regions and the periphery which then leads to a reduction in nociception.

References

    1. Poisbeau P, Grinevich V, Charlet A. Oxytocin signaling in pain: cellular, circuit, system, and behavioral levels. Curr. Top. Behav. Neurosci. 2018;35:193–211. doi: 10.1007/7854_2017_14. - DOI - PubMed
    1. Althammer, F. & Grinevich, V. Diversity of oxytocin neurons: beyond magno- and parvocellular cell types? J. Neuroendocrinol.30, e12549 (2018). - PubMed
    1. Eliava M, et al. A new population of parvocellular oxytocin neurons controlling magnocellular neuron activity and inflammatory pain processing. Neuron. 2016;89:1291–1304. doi: 10.1016/j.neuron.2016.01.041. - DOI - PMC - PubMed
    1. Gonzalez-Hernandez A, et al. Peripheral oxytocin receptors inhibit the nociceptive input signal to spinal dorsal horn wide-dynamic-range neurons. Pain. 2017;158:2117–2128. doi: 10.1097/j.pain.0000000000001024. - DOI - PubMed
    1. Moreno-Lopez Y, Martinez-Lorenzana G, Condes-Lara M, Rojas-Piloni G. Identification of oxytocin receptor in the dorsal horn and nociceptive dorsal root ganglion neurons. Neuropeptides. 2013;47:117–123. doi: 10.1016/j.npep.2012.09.008. - DOI - PubMed

Publication types