. 2023 Feb 24;14(1):1046.
doi: 10.1038/s41467-023-36456-6.

Social complexity, life-history and lineage influence the molecular basis of castes in vespid wasps

Affiliations

Social complexity, life-history and lineage influence the molecular basis of castes in vespid wasps

Christopher Douglas Robert Wyatt et al. Nat Commun. .

Abstract

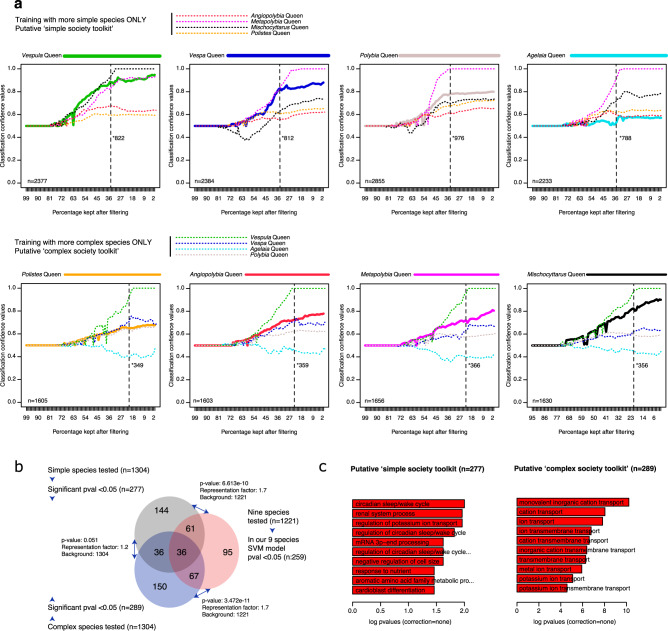
A key mechanistic hypothesis for the evolution of division of labour in social insects is that a shared set of genes co-opted from a common solitary ancestral ground plan (a genetic toolkit for sociality) regulates caste differentiation across levels of social complexity. Using brain transcriptome data from nine species of vespid wasps, we test for overlap in differentially expressed caste genes and use machine learning models to predict castes using different gene sets. We find evidence of a shared genetic toolkit across species representing different levels of social complexity. We also find evidence of additional fine-scale differences in predictive gene sets, functional enrichment and rates of gene evolution that are related to level of social complexity, lineage and of colony founding. These results suggest that the concept of a shared genetic toolkit for sociality may be too simplistic to fully describe the process of the major transition to sociality.


Conflict of interest statement

The authors declare no competing interests.

Figures

Fig. 1
Fig. 1. Social wasps as a model group.
The nine species of social wasps used in this study, and their characteristics in social complexity and life history. The Polistinae and Vespinae are two subfamilies comprising 1100+ and 67 species of social wasp respectively, all of which share the same common nonsocial ancestor, an eumenid-like solitary wasp. The Polistinae are an especially useful subfamily for studying the major transition as they include species exhibiting simple group living (with <10 individuals) of totipotent relatives, as well as species with varying degrees of more complex forms of sociality, with different colony sizes, levels of caste commitment and reproductive totipotency. The Vespinae include the yellow-jackets and hornets, and are all superorganismal, meaning caste is determined during development in caste-specific brood cells; they also show species-level variation in complexity, in terms of colony size and other superorganismal traits (e.g. multiple mating, worker policing). Ranked in order of increasing levels of social complexity, from simple to more complex, these species are: Mischocyttarus basimacula, Polistes canadensis, Angiopolybia pallens, Metapolybia cingulata, Polybia quadricincta, Agelaia cajennensis, Brachygastra mellifica, Vespa crabro and Vespula vulgaris (see Methods for further details of species choice). Where data on evidence of morphological castes was not available from the literature, we conducted morphometric analyses of representative queens and workers from several colonies per species (see Methods; Supplementary Data 8). With respect to life-history traits, all social wasps are generalist predators and so they share similar diets. Other traits vary across species: e.g. some species founding nests as a single queen (‘independent founding’) whilst others found new nests as a group of queen(s) with workers (‘swarm founding’); some species have open nests whilst others have an envelope. All Polistines included in this study are tropical, and all Vespines are temperate. The latter two traits are confounded by level of sociality and thus their influence on gene expression could not be disentangled. Image credits: M. basimacula (Stephen Cresswell). A. cajennesis (Gionorossi; Creative Commons); V. vulgaris (Donald Hobern; Creative Commons). V. crabro (Patrick Kennedy); P. canadensis; M. cingulata, A. pallens, P. quadricinta, (Seirian Sumner), B. mellifica (Amante Darmanin; Creative Commons).
Fig. 2
Fig. 2. Principal component analyses of orthologous gene expression before and after between-species normalisation.
a Principal component analyses performed using log2 transcript per million (TPM) gene expression values. This analysis used single-copy orthologs (using Orthofinder), allowing up to three gene isoforms in a single species to be present, whereby we took the most highly expressed to represent the orthogroup, as well as filtering of orthogroups which have expression below 10 counts per million. b Principal component analysis of the species-normalised and scaled TPM gene expression values using same filters as (a). Caste denoted by purple (queen) or blue (worker). Each species has a different shape/symbol. The percent of variation explained by the first two principal components is listed in brackets.
Fig. 3
Fig. 3. Overlap of differential caste-biased genes (queen vs worker) and their functions.
a Frequency of caste DEGs in multiple species (observed, bar-plot). Showing numbers of orthologous genes that are differentially expressed in 1 up to 9 species. At the top we show the average “expected” numbers of DEGs to overlap, based on 1000 permutations with random genes,”observed” and Fisher two-sided P values for each expected/observed frequency indicate that the observed overlap in DEGs are more than expected by chance. Symbols represent datasets used in the gene ontology analysis (b) and heatmap (c, to right). For the full list of genes, see Supplementary Data 3. b A histogram of overrepresented gene ontology terms of genes found differentially expressed in at least two out of the nine species (n = 562 genes; either queen or worker upregulated; without needing the DEG to be in same caste upregulated direction), using a background of all genes tested across the nine species. P values are single-tailed and Bonferroni corrected. c Heatmap showing the differential genes that are caste-biased in at least four species (identified using edgeR) using the orthologous genes present in the nine species. In cases where three isoforms exist for a single species orthogroup, only the isoform with greatest expression was considered, plus at least 2 species could have missing gene data for each orthogroup. Listed for each species (in brackets), is the total number of orthologous differentially expressed genes per species. Metapolybia Blast hits are listed along (right) with orthogroup name (left).
Fig. 4
Fig. 4. A genetic toolkit for social behaviours across eusocial wasps.
a Change in certainty of correct caste classifications through progressive feature selection using Support Vector Machine (SVM) approaches. Models were trained on eight species and tested on the ninth species, where we instruct the model as to which sample represents the queen and which the worker for the eight species. Features (a.k.a. orthologous genes) were sorted by linear regression (x axis) with regard to caste identity within the 8 training species, beginning at 99% where almost all genes were used for the predictions of caste, to 1% where only the top one percent of genes from the linear regression (sorted by P value) were used to train the model. ‘1.0’ equates to high queen classification certainty. This test was repeated using various filters, showing: LEFT: use of only 1 to 1 orthogroups, where no gene isoforms or missing values were accepted into the model, MIDDLE: allowing three gene isoforms (using the most highly expressed as the representative) and RIGHT: allowing three gene isoforms and missing values (NAs; up to 2 species with no ortholog), filling in with non-caste biased gene values for queen and worker. Horizontal guide markers are placed at 0.4, 0.5 and 0.6 respectively indicating the confidence score for classifying queens, and the vertical dotted line marks the percentage at which the regression score becomes <0.05. b Histograms indicate the Bonferroni-corrected enriched gene ontology (GO) terms for the top orthologous genes from the corresponding model above (linear regression P value < 0.05; shown as dotted line in upper plots), tested against a background of all genes used in the corresponding SVM model (i.e. with a single gene representative for all species in the test). P values are single-tailed. c) Heatmap of the top 50 genes after sorting by linear regression, in the SVM with 3 merged isoforms and 2 NAs; showing species-normalised gene expression levels in the nine species for queen (Q) and worker (W) samples (where red indicated down-regulation and blue up; row Z-score). Orthogroup name and top Metapolybia blast hit are listed to the right.
Fig. 5
Fig. 5. Testing for the presence of a distinct ‘simple society toolkit’ and a ‘complex society toolkit’.
a Using either the four species with the simpler or more complex societies, we trained SVM models with information as to which sample represents the queen and worker for the four species. We used a progressive filtering of genes (based on linear regression; the same method used in Fig. 4), to assess how well we could predict caste using more informative genes. UPPER panel: training with the four simpler species, and tested on each of the four more complex species. LOWER panel: training with the four more complex species, and tested on each of the four simpler species. Classification estimates of being a queen from 0 to 1 is plotted for each species across the progressively filtered sets. The total number of orthologous genes used in each SVM model are shown (bottom left of each panel); the total number of these genes that were significant predictors of caste (p value < 0.05) is listed at the dotted line. For each test (pair of Queen/Worker in each species), the SVM model was run using genes with only 1 homologous gene copy per species. b Overlap of significant genes among the three putative toolkits, comparing those genes for ‘simpler species’ (Fig. 5a UPPER panel), ‘more complex species’ (Fig. 5a LOWER panel), and ‘full spectrum’ (Fig. 4a- Left) toolkits. For each experiment, the number of orthogroups tested and the total number that were significant after linear regression are shown. Inside the Venn diagram are the numbers of these significant genes shared (or not) between the groups. Significant overlap is shown using hypergeometric tests (one-tailed). The colours represent the genes that predict caste in: the more complex societies (blue), the simpler societies (grey) and across the full spectrum (pink). c Enriched gene ontology terms (TopGO) using a background of all genes tested (n = 1304) for the two putative toolkits (focal sets n = 277 and n = 289), using an uncorrected single-tailed p values.

References

    1. Szathmáry E, Smith JM. The major evolutionary transitions. Nature. 1995;374:227–232. doi: 10.1038/374227a0. - DOI - PubMed
    1. Kennedy P, et al. Deconstructing superorganisms and societies to address big questions in biology. Trends Ecol. Evol. 2017;32:861–872. doi: 10.1016/j.tree.2017.08.004. - DOI - PubMed
    1. Toth AL, Robinson GE. Evo-devo and the evolution of social behavior. Trends Genet. 2007;23:334–341. doi: 10.1016/j.tig.2007.05.001. - DOI - PubMed
    1. Berens AJ, Hunt JH, Toth AL. Comparative transcriptomics of convergent evolution: different genes but conserved pathways underlie caste phenotypes across lineages of eusocial insects. Mol. Biol. Evol. 2014;32:690–703. doi: 10.1093/molbev/msu330. - DOI - PubMed
    1. Patalano S, et al. Molecular signatures of plastic phenotypes in two eusocial insect species with simple societies. Proc. Natl Acad. Sci. U. S. A. 2015;112:13970–13975. doi: 10.1073/pnas.1515937112. - DOI - PMC - PubMed

Publication types