. 2023 Feb 24;14(1):1055.
doi: 10.1038/s41467-023-36691-x.

Single-cell transcriptome profiling of the stepwise progression of head and neck cancer

Affiliations

Single-cell transcriptome profiling of the stepwise progression of head and neck cancer

Ji-Hye Choi et al. Nat Commun. .

Abstract

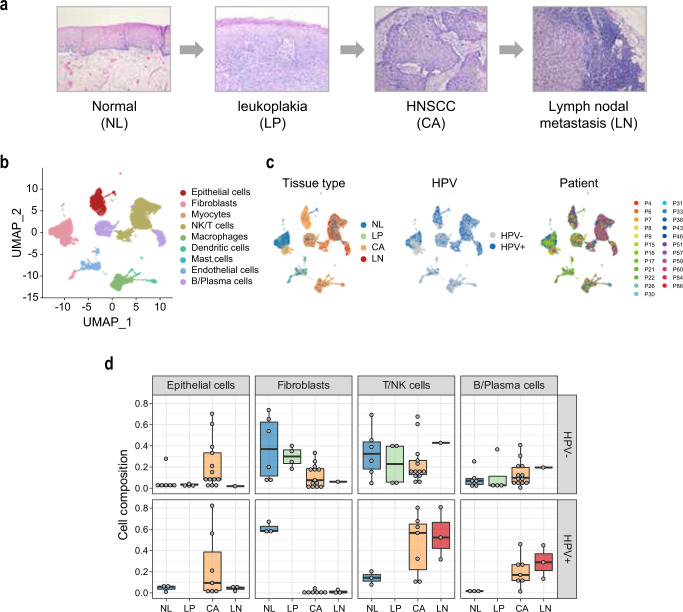
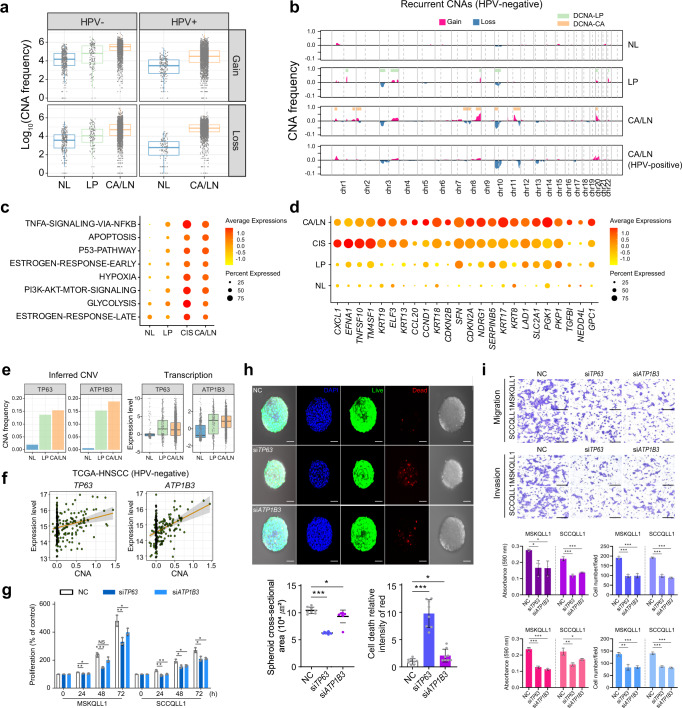
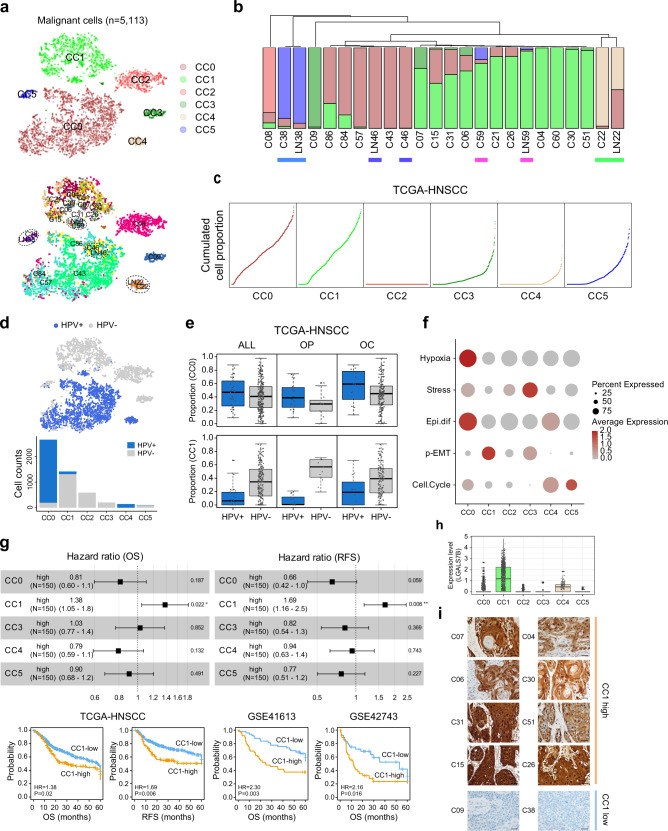
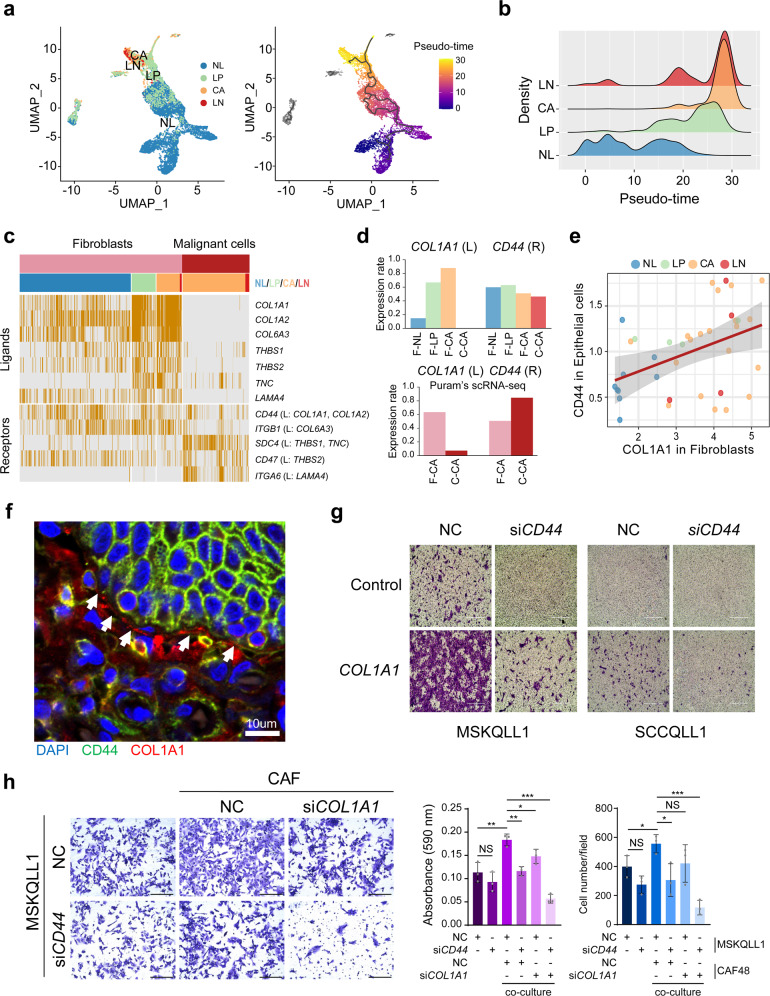
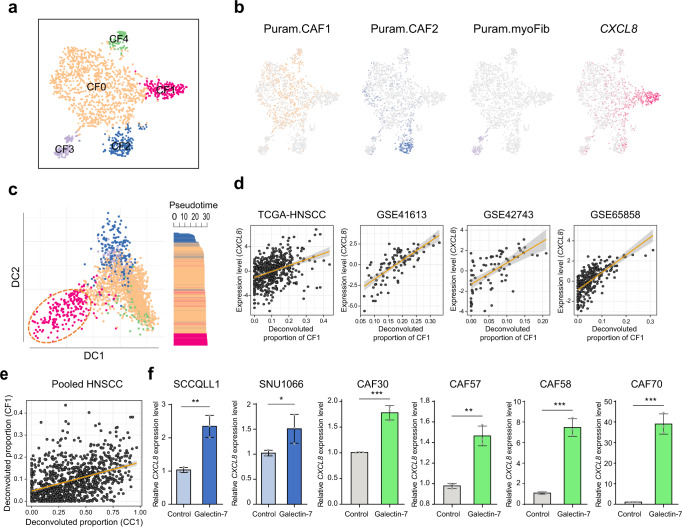
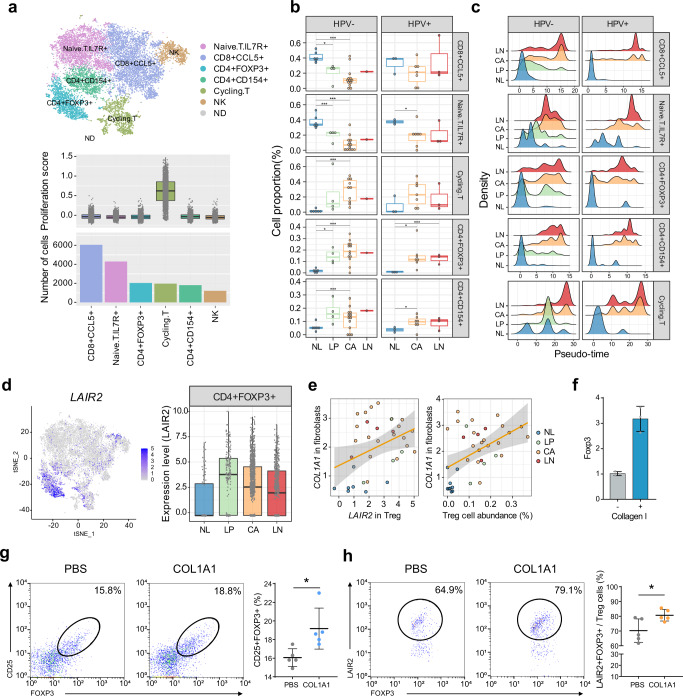
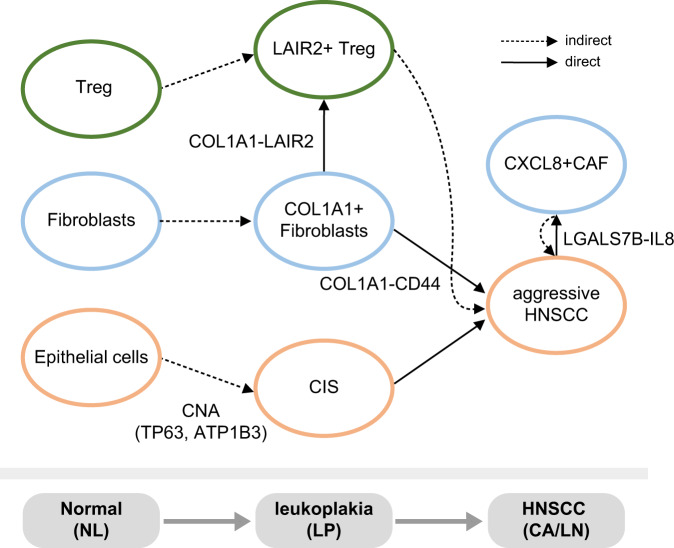
Head and neck squamous cell carcinoma (HNSCC) undergoes stepwise progression from normal tissues to precancerous leukoplakia, primary HNSCC, and metastasized tumors. To delineate the heterogeneity of tumor cells and their interactions during the progression of HNSCC, we employ single-cell RNA-seq profiling for normal to metastasized tumors. We can identify the carcinoma in situ cells in leukoplakia lesions that are not detected by pathological examination. In addition, we identify the cell type subsets of the Galectin 7B (LGALS7B)-expressing malignant cells and CXCL8-expressing fibroblasts, demonstrating that their abundance in tumor tissue is associated with unfavorable prognostic outcomes. We also demonstrate the interdependent ligand-receptor interaction of COL1A1 and CD44 between fibroblasts and malignant cells, facilitating HNSCC progression. Furthermore, we report that the regulatory T cells in leukoplakia and HNSCC tissues express LAIR2, providing a favorable environment for tumor growth. Taken together, our results update the pathobiological insights into cell-cell interactions during the stepwise progression of HNSCCs.


Conflict of interest statement

The authors declare no competing interests.

Figures

Fig. 1
Fig. 1. scRNA-seq profiling of the stepwise progression of HNSCC.
a A schematic diagram of the stepwise progression of HNSCC. b Cell types of the 54,239 cells are indicated in a UMAP plot. c Distribution of tissue types, HPV infection status, and individual patients are shown. d Cell compositions of the major cell types of epithelial cells (n = 6106), fibroblasts (n = 12,336), NK/T cells (n = 17,869), and B/Plasma cells (n = 7,437) are shown according to the tissue types and patients’ HPV infection status. Data points represent the average value of the cell type proportions in each sample. Box plots show the median (center line), the upper and lower quantiles (box), and the range of the data (whiskers). Source data are provided in a Source Data file.
Fig. 2
Fig. 2. DNA copy number-dependent deregulation of TP63 and ATP1B3 promotes HNSCC progression.
a For each tissue type, log-scaled frequencies of the CNA gains (top) and losses (bottom) in the HPV-negative and HPV-positive samples are shown. b CNA frequencies are shown in chromosomal order for each HPV-negative tissue type. c, d Dot plots show the differential expression of the Hallmark gene sets (c) and genes (d) in the epithelial cells across the tissue types of NL, LP, CIS, and CA/LN tissues. e Frequencies of the CNAs (left) and the expression levels (right) of TP63 and ATP1B3 genes in HPV-negative patients are shown. f DNA copy number-correlated transcriptional expression of TP63 and ATP1B3 are shown in the HPV-negative TCGA-HNSCC patients (n = 240). g The MSKQLL1 and SCCQLL1 cells are treated with the non-target control (NC), siTP63, or siATP1B3, and their viabilities are shown at indicated times. h FaDu cells are transfected with NC, siTP63, or siATP1B3 and cultured in spheroids using hanging drop plates, and the cell viability is shown (top). The cross-section area of FaDu cells (bottom left) and the numbers of dead cells (bottom right) with the treatment of NC, siTP63, or siATP1B3, are shown. n = 8 biologically independent experiments. Scale bar, 50 μm. i MSKQLL1 and SCCQLL1 cells are transfected with NC, siTP63, or siATP1B3, and their cell proliferation, migration, and invasion are shown. n = 3 biologically independent experiments. Scale bar, 100 μm. In gi data are shown as mean ± SD. *,P  <  0.05; **,P  <  0.01; ***,P  <  0.001; ns, nonsignificant by the Student two-tailed unpaired t-test. In a, e, box plots show median (center line), the upper and lower quantiles (box), and the range of the data (whiskers). Source data are provided in a Source Data file.
Fig. 3
Fig. 3. Malignant cell cluster with LGALS7 expression shows an aggressive phenotype.
a Malignant cell clusters (CC0-CC5, top) and samples (bottom) are shown in t-SNE plots. Paired primary and metastatic tumors are indicated (dotted circle). b The hierarchical clustering of the malignant clusters shows a similar cell proportion of the paired primary and metastatic tumors (underlined). c The cumulative cell proportion of the malignant cell clusters is shown in TCGA-HNSCC (n = 500). d The HPV infection status is indicated in a t-SNE plot (top). Cell counts of the HPV-positive and HPV-negative cells are shown across the malignant cell clusters (bottom). e According to the tumor subsites for all the patients (ALL, n = 500), OP (n = 71), and OC (n = 308), the proportions of the CC0 and CC1 malignant cell clusters in the HPV-positive and HPV-negative tissues are shown. f A dot plot shows the average expression levels of the single-cell malignant programs of HNSCC, including hypoxia, stress, epithelial differentiation, p-EMT, and cell cycle in each malignant cluster. g Forest plots show the hazard ratios for OS and RFS between the high- and low-proportion groups (>70th percentile) for each malignant cell cluster in the deconvoluted TCGA-HNSCC data (top). CC2 is not shown because its 70th percentile of cell proportion is zero. Hazard ratios and 95% confidence intervals (CI) are indicated. *,P  <  0.05 and **,P  <  0.01, log-rank test. Kaplan–Meier’s plot analyses for OS (left) or RFS (right) between the CC1-high and CC1-low groups are shown in TCGA-HNSCC, GSE41613, and GSE42743, respectively (bottom). P = 0.02 (OS; TCGA-HNSCC), P = 0.006 (RFS; TCGA-HNSCC), P = 0.003 (OS; GSE41613), P = 0.016 (OS; GSE42743), log-rank test. Follow-up time for OS and RFS is truncated to 5 years. h Expression levels of LGALS7B in the malignant cell clusters are shown. i Representative images of immunohistochemical staining for LGALS7B expression are shown in the CC1-high and CC1-low samples. n = 1. Scale bar, 100 µm. In e, h, box plots show the median (center line), the upper and lower quantiles (box), and the range of the data (whiskers). Source data are provided in a Source Data file.
Fig. 4
Fig. 4. Fibroblasts-derived COL1A1 expression interacts with CD44 in malignant cells.
a Tissue types of NL, LP, CA, and LN (left) and the pseudo-times (right) of the cells are shown in UMAP plots. b Distributions of the pseudo-time in the fibroblasts across the tissue types are shown. c A heatmap shows the interdependent expression of the ligand-receptor pairs with stepwise expression during HNSCC progression between fibroblasts and malignant cells. d The cell proportions for expressed cells of COL1A1 and CD44 are shown in fibroblasts (F-) and malignant cells (C-) across the tissue types (e.g., F-NL, fibroblasts in NL; C-NL, malignant cells in NL) from our data (top) and that of GSE103322 (bottom). e The correlation plot shows COL1A1 expression levels in fibroblasts and CD44 expression levels in epithelial cells in HNSCC patients. The gray shading represents 95% confidence interval (CI). f An immunohistochemical image shows the expression of collagen and CD44 in fibroblasts (red) and neighbored malignant cells (green), respectively. n = 3. g Invasion of the MSKQLL1 and SCCQLL1 cells treated with siRNAs targeting CD44 (siCD44) or non-target control (NC) in the presence or absence of collagen (1 µg/mL). n = 3. Scale bar, 400 µm. h MSKQLL1 cells and CAF cells are co-cultured with the treatment of NC, siCD44, or siCOL1A1, and the images of the migrated cells (left) and the measured cell population (right) are shown. n = 3 biologically independent experiments. Scale bar, 100 μm. Data are shown as mean ± SD. *,P  <  0.05; **,P  <  0.01; ***,P  <  0.001; ns, nonsignificant by the Student two-tailed unpaired t-test. Source data are provided in a Source Data file.
Fig. 5
Fig. 5. CXCL8-expressing CAFs aggravate HNSCC progression.
a CAF clusters are shown in a t-SNE plot (CF0-CF4). b Expression levels of the markers for CAF1, CAF2, myofibroblasts (myoFib), and a CF1 marker, CXCL8, are shown in t-SNE plots. c A diffusion map plot shows the CAF clusters (CF0-CF4, left). Pseudo-time scores across CAF clusters are shown (right). d The correlation plots show CXCL8 expression levels and the cell proportion of CF1 in independent data sets of TCGA-HNSCC, GSE41613, GSE42743, and GSE65858. e A plot shows the correlation between the proportion of CC1 and CF1 in pooled HNSCC data (TCGA-HNSCC, GSE41613, GSE42743, and GSE65858, n = 941). In d, e The gray shading represents 95% confidence interval (CI). f CXCL8 expression levels in the presence or absence of galectin-7 are shown in HNSCC cells (SCCQLL1 and SNU1088) and CAF cells (CAF30, CAF57, CAF58, and CAF70). P = 0.0025 (SCCQLL1), P = 0.0457 (SNU1088), P = 0.0007 (CAF30), P = 0.0011 (CAF57), P = 0.0002 (CAF58), P = 0.0002 (CAF70). n = 3 biologically independent experiments. Data are shown as mean ± SD. *,P  <  0.05; **,P  <  0.01; ***,P  <  0.001; ns, nonsignificant by the Student’s two-tailed unpaired t-test. Source data are provided in a Source Data file.
Fig. 6
Fig. 6. LAIR2 expression in CD4+FOXP3+ T cells is associated with HNSCC progression.
a A t-SNE plot shows the T/NK cell clusters including naïve T (IL7R+), CD8+CCL5+, Treg (CD4+FOXP3+), CD4+CD154+, cycling T, and NK cells (top). ND, non-determined. Proliferation scores and the number of cells across T cell clusters are shown (bottom). b Boxplots show the proportion of the T cell clusters according to the tissue types and HPV infection status. Statistical significance of the two-sided t-tests is indicated. c Distributions of the pseudo-times in each T cell cluster are shown according to the tissue types and HPV infection status. d A t-SNE plot shows the LAIR2 expression in the Tregs (left). Stepwise expression of LAIR2 in Tregs across the tissue types is shown (right). e Correlation plots show the COL1A1 expression levels in fibroblasts with the LAIR2 expression levels in Tregs (left) or the proportion of Tregs (right) across the tissue types. 95% confidence interval (CI) is indicated with gray color. f FOXP3 expression levels are measured by RT-PCR in the Tregs (see “Methods”) treated with or without collagen I (10 µg/mL), respectively. n = 3 biologically independent experiments. Data are shown as mean ± SD. g Representative FACS analysis shows the percentages of the FOXP3+CD25+Tregs in PBMCs (left). A dot plot shows the percentages of FOXP3+CD25+Tregs in the PBMCs treated with phosphate-buffered saline (PBS) or collagen I, respectively (right). P = 0.0194. For each group, PBMCs from five patients were evaluated. h Representative FACS analysis shows the LAIR2 +FOXP3+Tregs in the PBMCs treated with PBS or collagen, respectively (left). A dot plot shows the percentages of LAIR2+FOXP3+CD25+Tregs in the PBMCs treated with PBS or collagen I, respectively (right). P = 0.0298. In g, h, for each group, PBMCs from five patients were evaluated. *,P  <  0.05; **,P  <  0.01; ***,P  <  0.001; ns, nonsignificant by the Student two-tailed unpaired t-test. In a, b, d, box plots show the median (center line), the upper and lower quantiles (box), and the range of the data (whiskers). Source data are provided as a Source Data file.
Fig. 7
Fig. 7. Graphical summary of the cell-cell interactions during stepwise HNSCC progression.
The key findings regarding the interactions among the malignant cells, fibroblasts, and immune cells are summarized.

References

    1. Pulte D, Brenner H. Changes in survival in head and neck cancers in the late 20th and early 21st century: a period analysis. Oncologist. 2010;15:994–1001. doi: 10.1634/theoncologist.2009-0289. - DOI - PMC - PubMed
    1. Cancer Genome Atlas N. Comprehensive genomic characterization of head and neck squamous cell carcinomas. Nature. 2015;517:576–582. doi: 10.1038/nature14129. - DOI - PMC - PubMed
    1. Kim K, et al. Single-cell transcriptome analysis reveals TOX as a promoting factor for T cell exhaustion and a predictor for anti-PD-1 responses in human cancer. Genome Med. 2020;12:22. doi: 10.1186/s13073-020-00722-9. - DOI - PMC - PubMed
    1. Pinto AC, et al. Malignant transformation rate of oral leukoplakia-systematic review. Oral. Surg. Oral. Med Oral. Pathol. Oral. Radio. 2020;129:600–611.e602. doi: 10.1016/j.oooo.2020.02.017. - DOI - PubMed
    1. Ang KK, et al. Human papillomavirus and survival of patients with oropharyngeal cancer. N. Engl. J. Med. 2010;363:24–35. doi: 10.1056/NEJMoa0912217. - DOI - PMC - PubMed

Publication types