. 2023 Feb 24;13(1):3250.
doi: 10.1038/s41598-023-28488-1.

Genetic diversity of virus auxiliary metabolism genes associated with phosphorus metabolism in Napahai plateau wetland

Affiliations

Genetic diversity of virus auxiliary metabolism genes associated with phosphorus metabolism in Napahai plateau wetland

Hang Yu et al. Sci Rep. .

Abstract

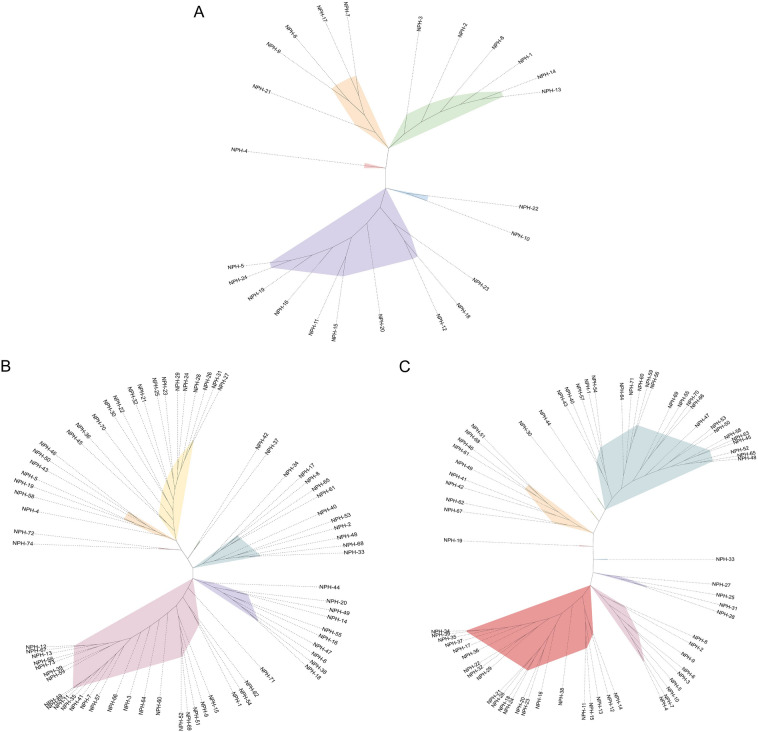
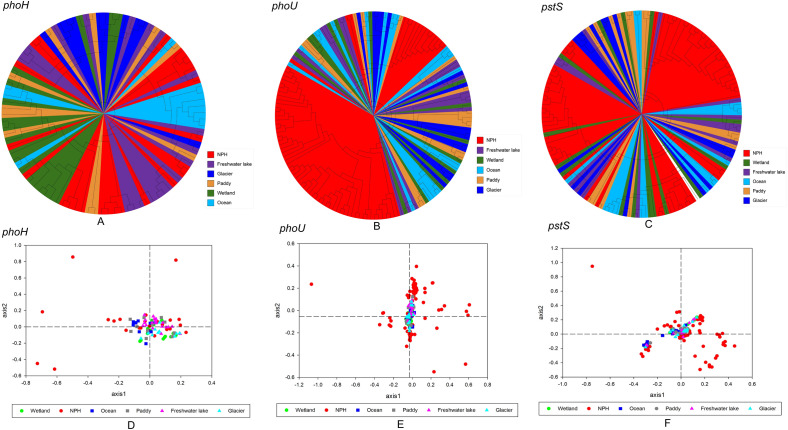
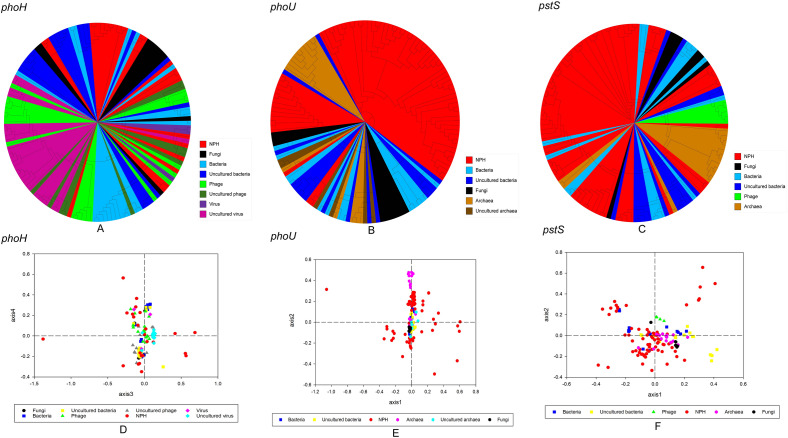
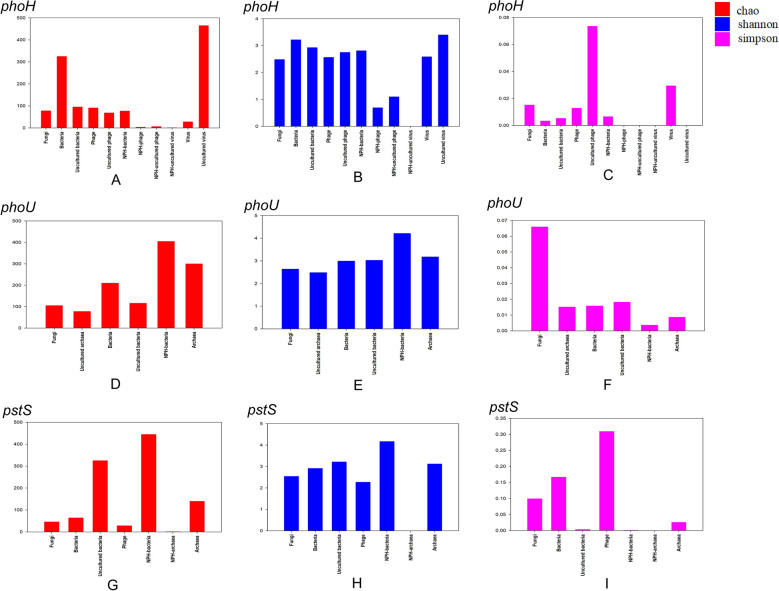
Viruses play important roles in ecosystems by interfering with the central metabolic pathways of the host during infection via the expression of auxiliary metabolic genes (AMGs), altering the productivity of ecosystems and thus affecting geochemical cycling. In this study, the genetic diversity of phosphorus metabolism AMGs phoH, phoU and pstS was investigated by phylogenetic analysis, PCoA analysis, and alpha diversity analysis based on metagenomic data. It was found that the majority of the sequences were unique to Napahai plateau wetland. It was shown that the genetic diversity of phoH, phoU and pstS genes was independent of both habitats and host origins. In addition, the metabolic pathway of AMGs associated with the phosphorus cycling was identified based on metagenomic data. When phosphorus is deficient, virus utilizes AMGs to affect the metabolic pathway, contributing to higher phosphorus levels in the host and facilitating virus survival, replication, and propagation in the host cell.


Conflict of interest statement

The authors declare no competing interests.

Figures

Figure 1
Figure 1
Phylogenetic analysis of phosphorus metabolism AMGs in Napahai plateau wetland, different colors represent different branches. (A) Phylogenetic analysis of phoH genes. (B) Phylogenetic analysis of phoU genes. (C) Phylogenetic analysis of pstS genes.
Figure 2
Figure 2
Phylogenetic analysis and PCoA of phosphorus metabolism AMGs in different habitats, different colors represent different habitats. (A) Phylogenetic analysis of phoH genes in different habitats. (B) Phylogenetic analysis of phoU genes in different habitats. (C) Phylogenetic analysis of pstS genes in different habitats. (D) PCoA analysis of phoH genes in different habitats. (E) PCoA analysis of phoU genes in different habitats. (F) PCoA analysis of pstS genes in different habitats.
Figure 3
Figure 3
Phylogenetic analysis and PCoA of phosphorus metabolism AMGs from different host origins, different colors represent different host origins. (A) Phylogenetic analysis of phoH gene from different host origins. (B) Phylogenetic analysis of phoU gene from different host origins. (C) Phylogenetic analysis of pstS gene from different host origins. (D) PCoA analysis of phoH genes from different host origins. (E) PCoA analysis of phoU genes from different host origins. (F) PCoA analysis of pstS genes from different host origins.
Figure 4
Figure 4
Plots of genetic diversity indices analysis of phosphorus metabolism AMGs in different habitats, different colors represent different genetic diversity indices. (A, D, G) Represent respectively the Chao values of phoH, phoU, and pstS genes in different habitats. (B, E, H) Represent respectively the Shannon values of phoH, phoU, and pstS genes in different habitats. (C, F, I) Represent respectively the Simpson values of phoH, phoU, and pstS genes in different habitats.
Figure 5
Figure 5
Plots of genetic diversity indices analysis of phosphorus metabolism AMGs from different host origins, different colors represent different genetic diversity indices. (A, D, G) Represent respectively the Chao values of phoH, phoU, and pstS genes from different host origins. (B, E, H) Represent respectively the Shannon values of phoH, phoU, and pstS genes from different host origins. (C, F, I) Represent respectively the Simpson values of phoH, phoU, and pstS genes from different host origins.
Figure 6
Figure 6
Biogeochemical cycling of AMGs associated with phosphorus metabolism in Napahai plateau wetland. Red line indicates the process of phosphorus metabolism.

References

    1. Ruiz-Perez CA, Tsementzi D, Hatt JK, Sullivan MB, Konstantinidis KT. Prevalence of viral photosynthesis genes along a freshwater to saltwater transect in Southeast USA. Environ. Microbiol. Rep. 2019;11:672–689. doi: 10.1111/1758-2229.12780. - DOI - PubMed
    1. Huang X, Jiao N, Zhang R. The genomic content and context of auxiliary metabolic genes in roseophages. Environ. Microbiol. 2021;23:3743–3757. doi: 10.1111/1462-2920.15412. - DOI - PubMed
    1. Crummett LT, Puxty RJ, Weihe C, Marston MF, Martiny JBH. The genomic content and context of auxiliary metabolic genes in marine cyanomyoviruses. Virology. 2016;499:219–229. doi: 10.1016/j.virol.2016.09.016. - DOI - PubMed
    1. Weynberg KD, et al. Coral-associated viral communities show high levels of diversity and host auxiliary functions. PeerJ. 2017;5:e4054. doi: 10.7717/peerj.4054. - DOI - PMC - PubMed
    1. Jiang T, et al. Isolation and complete genome sequence of a novel cyanophage, S-B05, infecting an estuarine Synechococcus strain: Insights into environmental adaptation. Adv. Virol. 2020;165:1397–1407. doi: 10.1007/s00705-020-04595-6. - DOI - PubMed

Publication types