

Similar cortical morphometry trajectories from 5 to 9 years in children with perinatal HIV who started treatment before age 2 years and uninfected controls
- PMID: 36829110
- PMCID: PMC9951512
- DOI: 10.1186/s12868-023-00783-7
Similar cortical morphometry trajectories from 5 to 9 years in children with perinatal HIV who started treatment before age 2 years and uninfected controls
Erratum in
-
Correction to: Similar cortical morphometry trajectories from 5 to 9 years in children with perinatal HIV who started treatment before age 2 years and uninfected controls.BMC Neurosci. 2023 Jul 12;24(1):36. doi: 10.1186/s12868-023-00802-7. BMC Neurosci. 2023. PMID: 37438704 Free PMC article. No abstract available.
Abstract
Background: Life-long early ART (started before age 2 years), often with periods of treatment interruption, is now the standard of care in pediatric HIV infection. Although cross-sectional studies have investigated HIV-related differences in cortical morphology in the setting of early ART and ART interruption, the long-term impact on cortical developmental trajectories is unclear. This study compares the longitudinal trajectories of cortical thickness and folding (gyrification) from age 5 to 9 years in a subset of children perinatally infected with HIV (CPHIV) from the Children with HIV Early antiRetroviral therapy (CHER) trial to age-matched children without HIV infection.
Methods: 75 CHER participants in follow-up care at FAMCRU (Family Centre for Research with Ubuntu), as well as 66 age-matched controls, received magnetic resonance imaging (MRI) on a 3 T Siemens Allegra at ages 5, 7 and/or 9 years. MR images were processed, and cortical surfaces reconstructed using the FreeSurfer longitudinal processing stream. Vertex-wise linear mixed effects (LME) analyses were performed across the whole brain to compare the means and linear rates of change of cortical thickness and gyrification from 5 to 9 years between CPHIV and controls, as well as to examine effects of ART interruption.
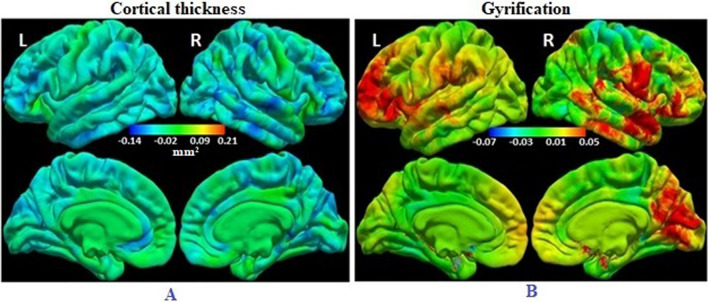
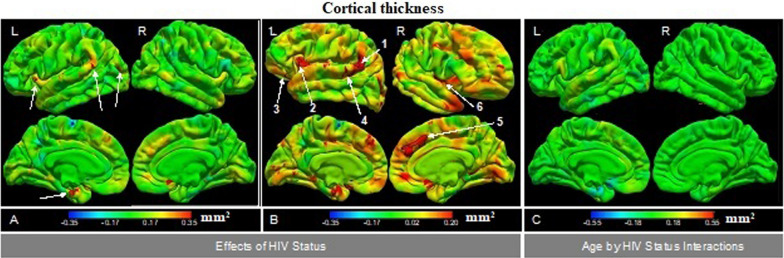
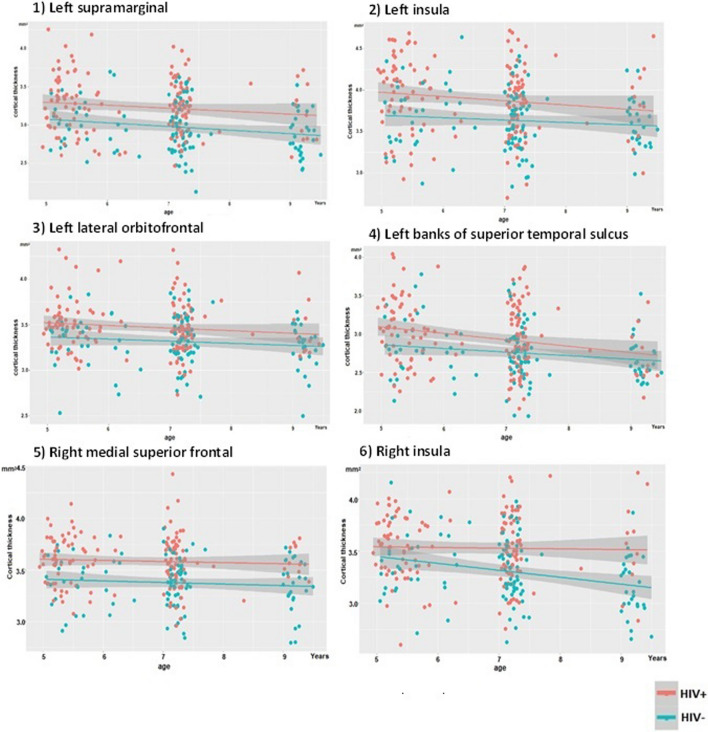
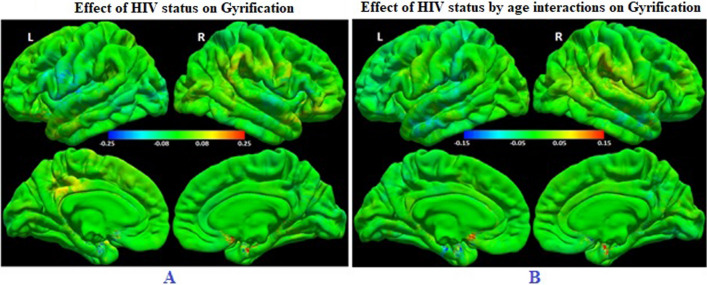
Results: Children without HIV demonstrated generalized cortical thinning from 5 to 9 years, with the rate of thinning varying by region, as well as regional age-related gyrification increases. Overall, the means and developmental trajectories of cortical thickness and gyrification were similar in CPHIV. However, at an uncorrected p < 0.005, 6 regions were identified where the cortex of CPHIV was thicker than in uninfected children, namely bilateral insula, left supramarginal, lateral orbitofrontal and superior temporal, and right medial superior frontal regions. Planned ART interruption did not affect development of cortical morphometry.
Conclusions: Although our results suggest that normal development of cortical morphometry between the ages of 5 and 9 years is preserved in CPHIV who started ART early, these findings require further confirmation with longitudinal follow-up through the vulnerable adolescent period.
Keywords: CHER; Children with HIV; Cortical thickness; FreeSurfer; Gyrification; Longitudinal; Vertex-wise.
© 2023. The Author(s).
Conflict of interest statement
The authors declare that they have no competing interests.
Figures
References
-
- UNAIDS. Global HIV & AIDS statistics—Fact sheet. 2022. Source: 2022. https://www.unaids.org/en/resources/fact-sheet. Accessed Aug 24.
-
- World Health Organization (WHO) Report of the WHO technical reference group. Paediatric HIV/ART care guideline group meeting. Geneva: WHO Headquarter; 2008.
Publication types
MeSH terms
Grants and funding
LinkOut - more resources
Full Text Sources
Medical
