. 2023 Jan 28;12(2):196.
doi: 10.3390/biology12020196.

Cognitive Healthy Aging in Mice: Boosting Memory by an Ergothioneine-Rich Hericium erinaceus Primordium Extract

Affiliations

Cognitive Healthy Aging in Mice: Boosting Memory by an Ergothioneine-Rich Hericium erinaceus Primordium Extract

Elisa Roda et al. Biology (Basel). .

Abstract

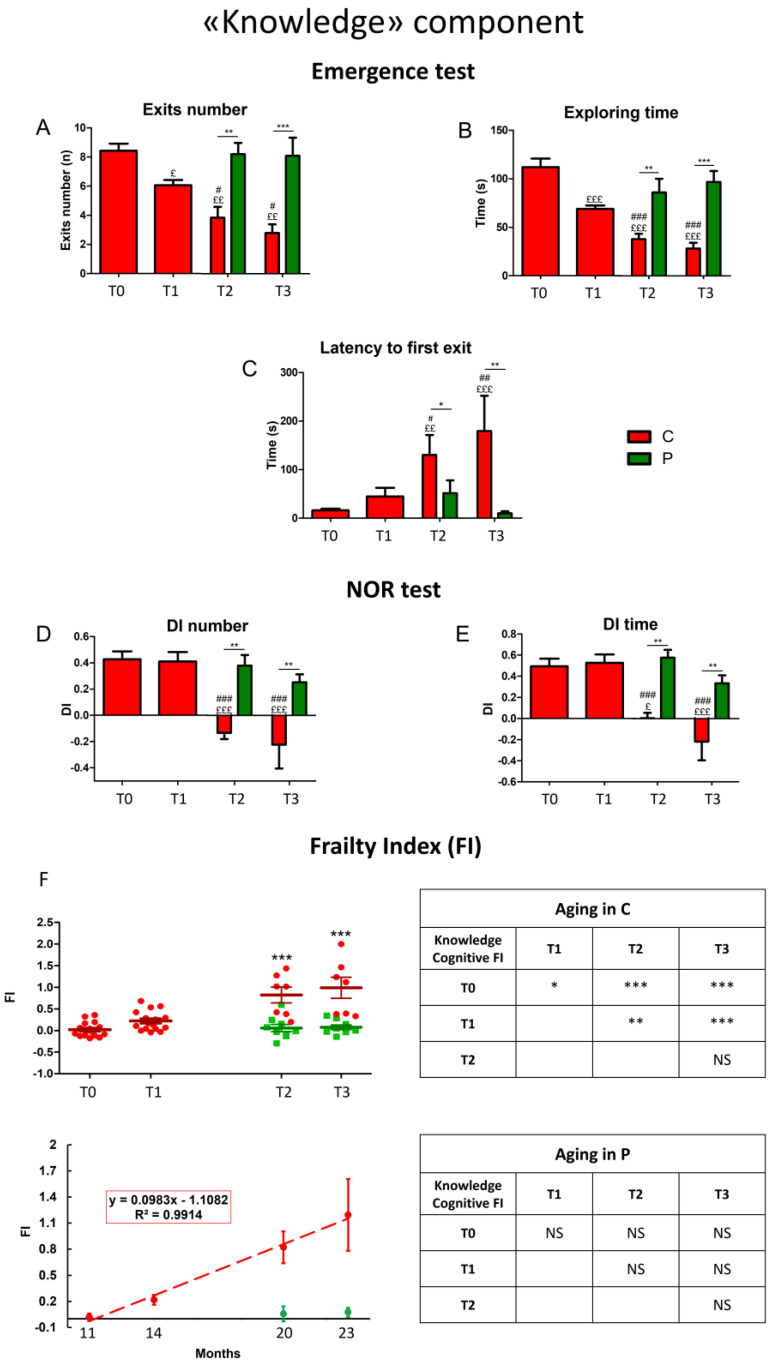
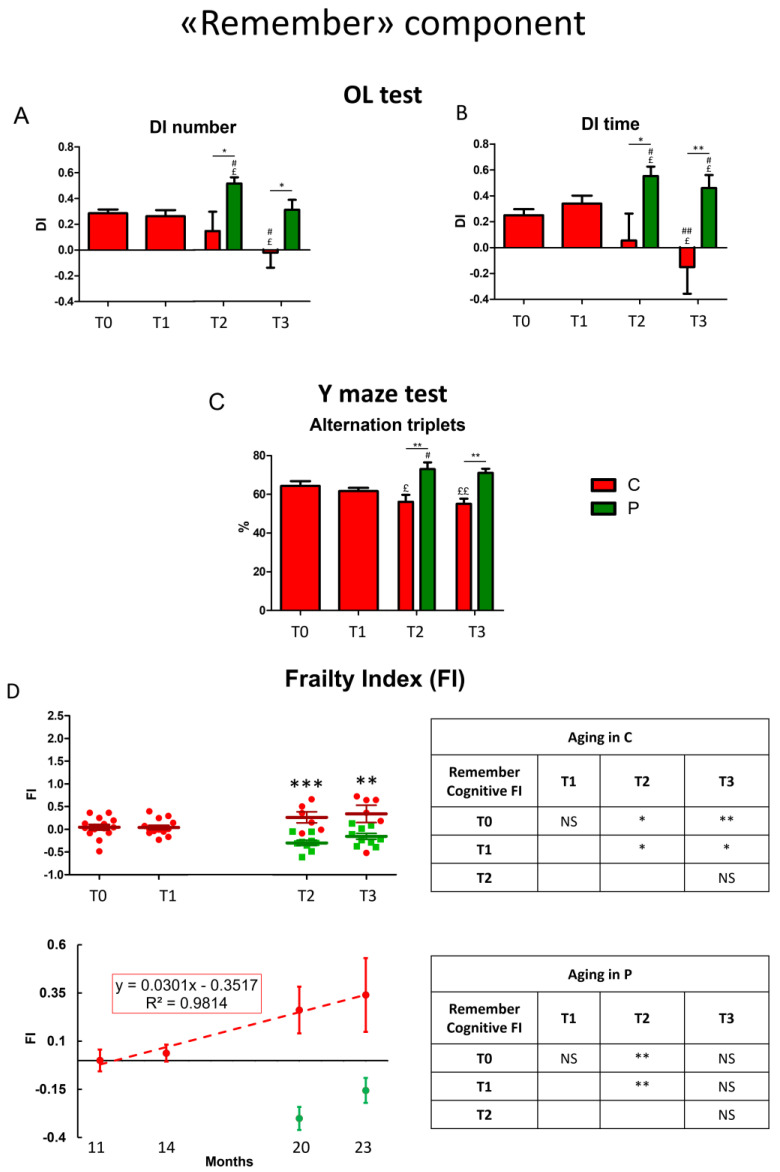
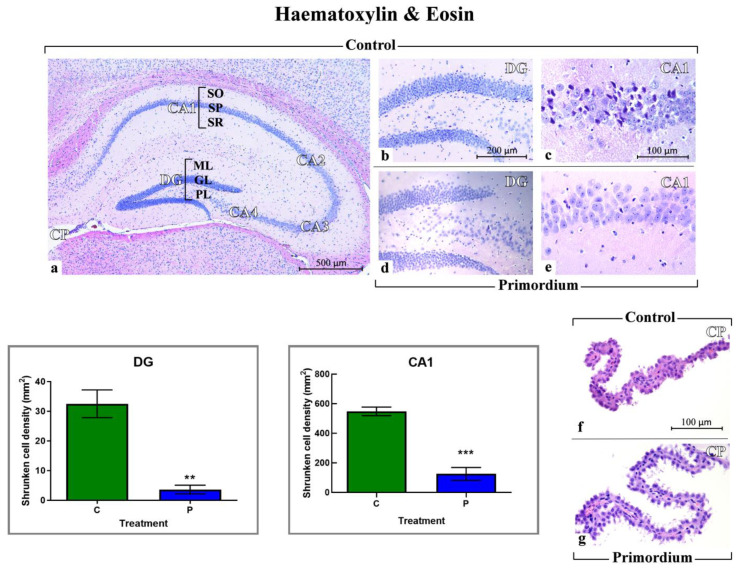
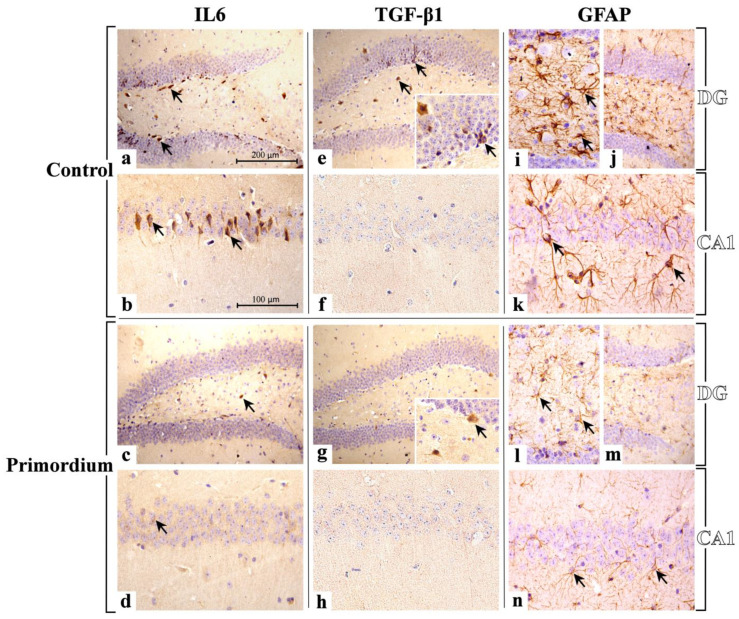
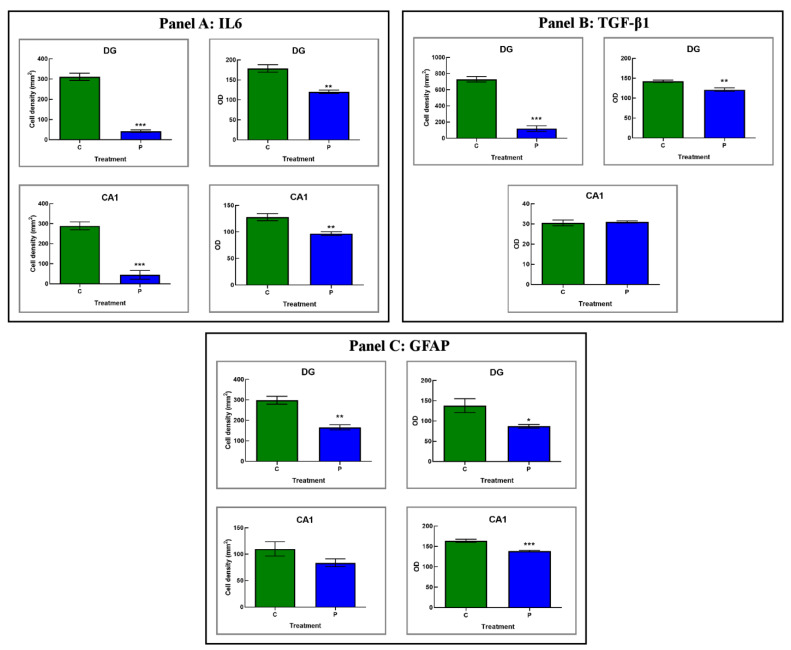
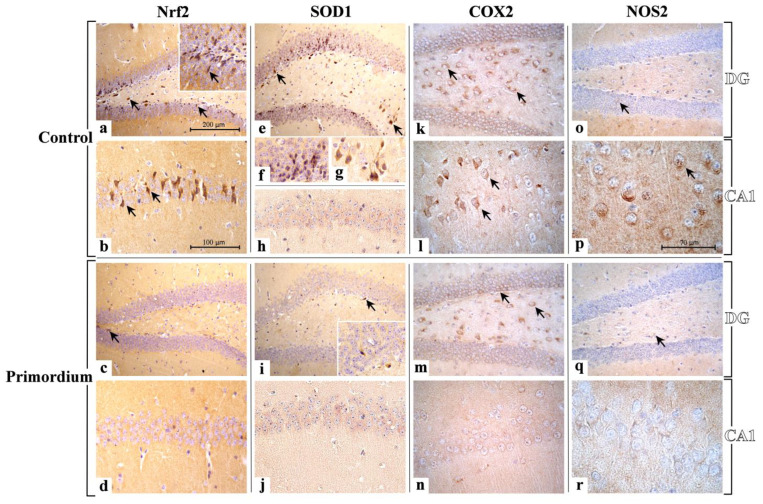
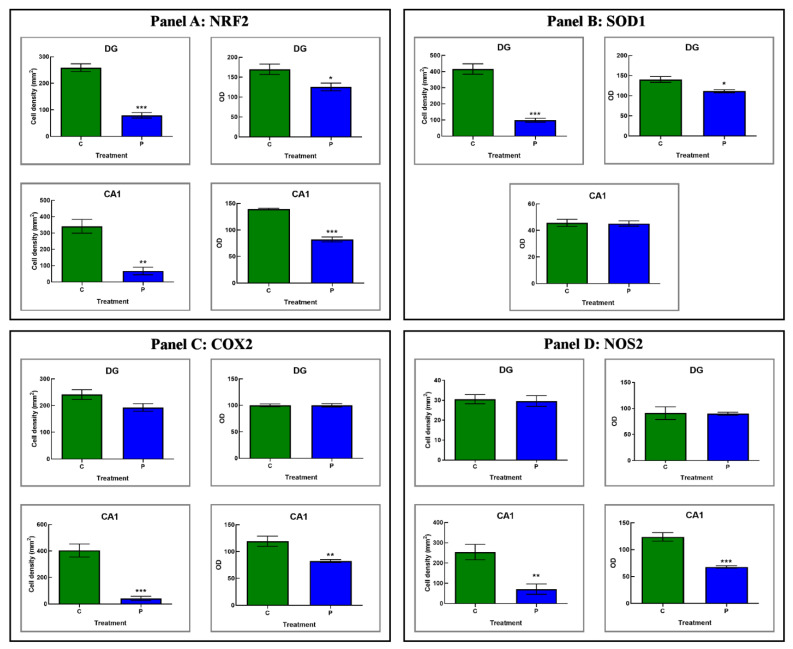
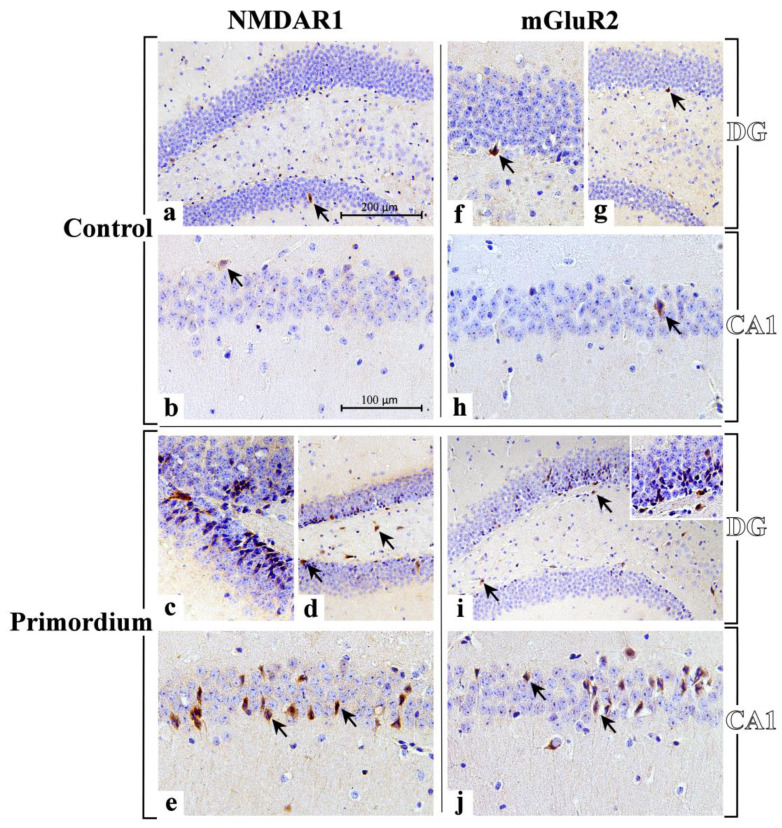
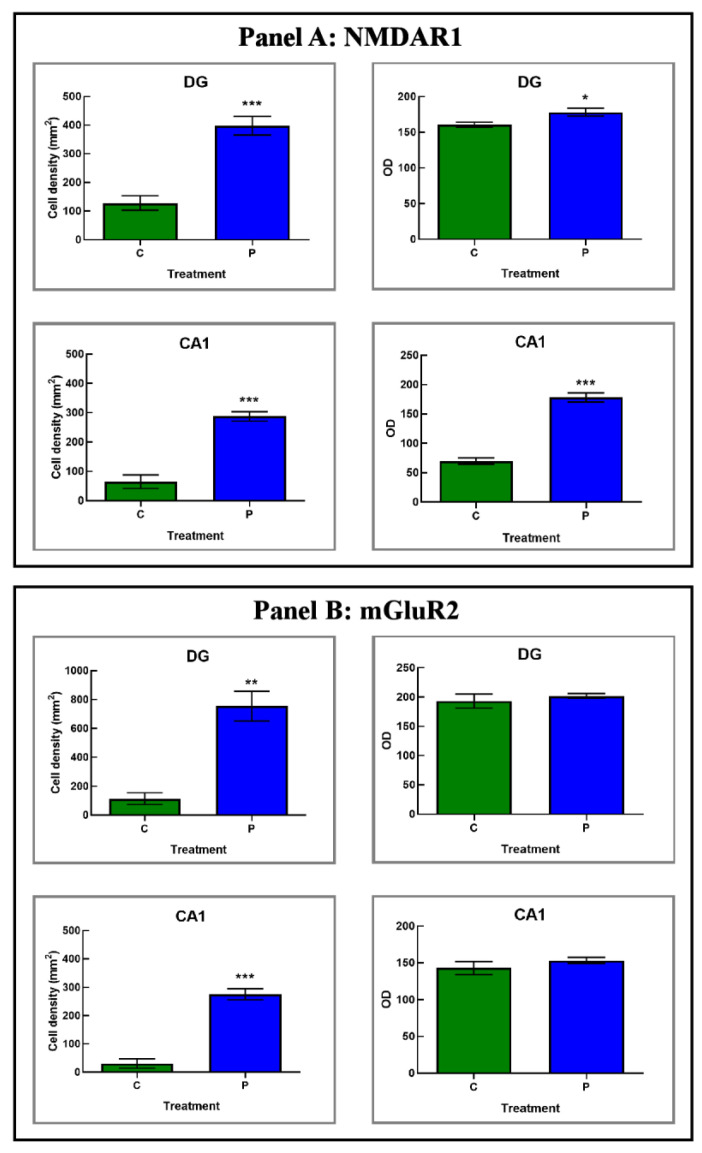
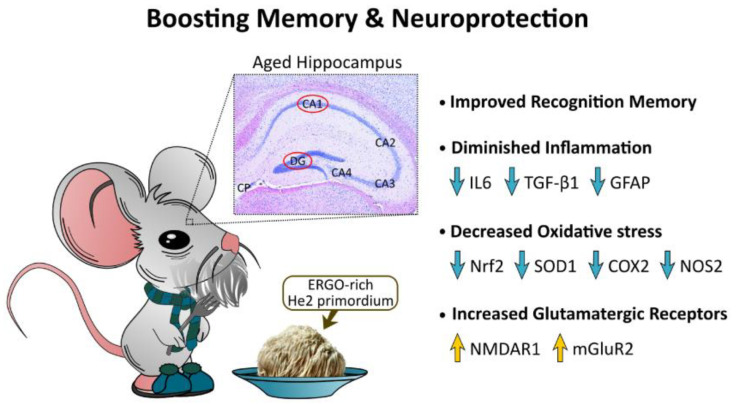
Brain aging is a crucial risk factor for several neurodegenerative disorders and dementia. The most affected cognitive function is memory, worsening early during aging. Inflammation and oxidative stress are known to have a role in pathogenesis of cognitive impairments, and a link exists between aging/frailty and immunosenescence/inflammaging. Based on anti-aging properties, medicinal mushrooms represent a source to develop medicines and functional foods. In particular, Hericium erinaceus (He) displays several actions ranging from boosting the immune system to fighting senescence, due to its active ingredients/metabolites. Among these, Ergothioneine (ERGO) is known as the longevity vitamin. Currently, we demonstrated the efficacy of an ERGO-rich He primordium extract (He2) in preventing cognitive decline in a murine model of aging. We focused on recognition memory deterioration during aging, monitored through spontaneous behavioral tests assessing both memory components and frailty index. A parallel significant decrease in key markers of inflammation and oxidative stress, i.e., IL6, TGFβ1, GFAP, Nrf2, SOD1, COX2, NOS2, was revealed in the hippocampus by immunohistochemistry, accompanied by an enhancement of NMDAR1and mGluR2, crucially involved in glutamatergic neurotransmission. In summary, we disclosed a selective, preventive and neuroprotective effect of He2 on aged hippocampus, both on recognition memory as well on inflammation/oxidative stress/glutamate receptors expression.

Keywords: Hericium erinaceus primordium; aging; ergothioneine; frailty; hippocampus; inflammation; medicinal mushroom supplementation; memory; neuroprotection; oxidative stress.


Conflict of interest statement

The authors declare no conflict of interest.

Figures

Figure 1
Figure 1
Physiological decline of the “Knowledge” component of recognition memory during aging in control mice and neuroprotection by He2 primordium extract in supplemented mice. For each panel, control (C) animals are represented with red bars, dots, and histograms, whereas supplemented (P) mice are symbolized by green bars, dots, and histograms. Panel (AC) refer to Emergence test: (A) exits number, (B) exploring time, (C) 1st latency to firs exit. Panel (D,E) describe NOR test: (D) discrimination index (DI) of number of approaches, (E) DI of time of approaches. Panel (F): scatter plot showing integrated FIs for individual C and P mice (left upright); linear least-square regression of experimental points averaged data (left downright). Separated tables on the right display statistical results about aging effect in C (upright) and P (downright) animals. Statistically significant data: p < 0.05 (£, #, *); p < 0.01 (££, ##, **); p < 0.001 (£££, ###, ***).
Figure 2
Figure 2
Physiological decline of the “Remember” component of recognition memory during aging in control mice and neuroprotection by He2 primordium extract in supplemented mice. For each panel, control (C) animals are represented with red bars, dots, and histograms, while supplemented (P) mice are symbolized by green bars, dots, and histograms. Panel (A,B) describe OL test: discrimination index (DI) of the number (A) and time of approaches (B). Panel (C) is related to Y maze task (alternation triplets %). Panel (D) display Remember cognitive Frailty Index (FI): scatter plot showing integrated FIs for individual C and P mice (left upright); linear least-square regression of experimental points averaged data (left downright). On the right, separated tables report statistical data concerning age-related effect in C (upright) and P (downright) mice. Statistically significant data: p < 0.05 (£, #, *); p < 0.01 (££, ##, **); p < 0.001 (***).
Figure 3
Figure 3
Histological characterization by H&E staining. Representative brain sections, showing the well-preserved physiological hippocampal cytoarchitecture both in non-supplemented controls (ad) and P (d,e) aged mice. (a): low magnification micrograph shows the whole hippocampus, formed of cornu Ammonis (CA) and dentate gyrus (DG). CA is further partitioned into: CA1, CA2, CA3 and CA4. The choroid plexus (CP) of the lateral ventricle can be also observed. (b,d): higher magnifications of the DG area revealing well-defined three layers: molecular layer (ML), granule cell layer (GL) and pleomorphic layers (PL). (c,e): higher magnifications of the CA1 region, showing the typical three layered-structure. Outer polymorphic layer, i.e., Stratum oriens (SO); middle pyramidal cell layer, namely Stratum pyramidale (SP); inner molecular layer, i.e., Stratum radiatum (SR). (f,g): choroid plexus (CP) in C and P mice, respectively. (f): evident structural alterations were observable, with ependymal cells displaying cilia reduction. Light microscopy magnification: 40× (a), 200× (b,d), 400× (c,eg). Scale bars: 500 µM (a); 200 µM (b,d); 100 µM (c,eg). Lower left panels: Histograms showing the quantitative assessment of shrunken cell density in DG and CA1 region of Ammon’s horn. p values calculated by unpaired Student’s t-test: p < 0.01 (**), and p < 0.001 (***).
Figure 4
Figure 4
Immunostaining patterns of IL6 (ad), TGFβ1 (eh) and GFAP (in) expression in C animals (a,b,e,f,ik) and P (c,d,g,h,ln) mice. IL6: an evident IL6 immunolabelling is observable both in DG and CA1 of C mice ((a,b), respectively), showing several markedly immunopositive neurons (arrows). Diversely, in supplemented P mice, a pale IL6-immunopositivity is observed in both areas ((c,d) for DG and CA, respectively), where rare immunolabelled cells are discernible (arrows). TGFβ1: a strong immunoreactivity for TGFβ1 is observed mainly in DG of C mice (e), where different clusters of immunopositive neurons are visible (arrows). Sporadic immunopositive cells (arrows) are observed in the DG of P animals (g). Differently, any immunostaining is observable in CA1 region of both C and P mice ((f,h), respectively). GFAP: a widespread GFAP immunolabelling is distributed both in DG and CA1 of C (ik) and P (ln) mice. In particular, in C animals, a carpet of GFAP-immunopositive astrocytes is clearly evident, showing thickened and intensely stained soma and prolongations (arrows). Light microscopy magnification: 200× (a,c,e,g,j,m); 400× (b,d,f,h,i,k,l,n); 600× (Insert in e,g). Scale bars: 200 µM (a,c,e,g,j,m); 100 µM (b,d,f,h,i,k,l,n).
Figure 5
Figure 5
Panels (AC): Histograms showing the quantitative analysis of IL6-, TGFβ1- and GFAP-immunopositive cell density and OD, respectively, as determined in DG and CA1 region of C and P mice. p values calculated by unpaired Student’s t-test: p < 0.05 (*), p < 0.01 (**), and p < 0.001 (***).
Figure 6
Figure 6
Representative micrographs showing Nrf2, SOD1, COX2 and NOS2 immunohistochemical expression in DG and CA1 area from non-supplemented C animals ((a,b,eh,k,l,o,p), respectively) and P ((c,d,i,j,m,n,q,r), respectively) mice. Nrf2: the heaviest immunopositivity is detectable almost exclusively in C mice (a,b), mainly in the DG region (a), with several markedly immunopositive cells closed to the SGZ (arrows), and also in the PL, where bigger immunoreactive neurons are observable (arrows). Nrf2 antigen is also overexpressed in pyramidal neurons of CA1 region (b). Diversely, immunopositive cells are rarely detectable in P mice (c,d), only in the DG (c) while the CA1 lacks immunoreactivity (d). SOD1: heavily immunopositive cells, localized both in the width of the GL as well as nearby the SGZ, are clearly visible in the DG (e,f) of C mice (eh). Also, strongly immunomarked neurons appear evident in the PL (g). Few immunopositive cells are observed in DG of P mice (i). A widespread lack of SOD1-immunoreactivity is detectable in the CA1 region both in C and P animals ((h,j), respectively). COX2: the strongest immunopositivity was detected in the DG of both C and P animals ((k,m), respectively), showing several immunoreactive neurons in the PL (arrows). Several strongly immunomarked pyramidal neurons are observable in the CA1 area of P mice (l), while a complete absence of immunoreactivity is evident in C animals (n). NOS2: a scarce NOS-immunopositivity was observed in the DG of both C and P mice (o,q, respectively), where palely immunoreactive cells are visible in the PL (arrows). An evident immunoreactivity is identifiable in neurons (arrows) located in the CA1 region of C mice (p), while a complete absence of immunopositivity is visible in P animals (r). Light microscopy magnification: 200× (a,c,e,i,k,m,o,q); 400× (b,d,h,j,l,n); 600× ((f,g,p,r) and insert in (a,i)). Scale bars: 200 µM (a,c,e,i,k,m,o,q); 100 µM (b,d,f,g,h,j,l,n); 70 µM (p,r).
Figure 7
Figure 7
Panels (AD): Histograms showing the quantitative assessment of Nrf2-, SOD1-, COX2- and NOS2-immunopositive cell density and OD, respectively, measured in DG and CA1 region of C and P mice. p values calculated by unpaired Student’s t-test: p < 0.05 (*), p < 0.01 (**), and p < 0.001 (***).
Figure 8
Figure 8
Immunohistochemical labelling for NMDAR1 and mGluR2 in DG and CA1 region from C animals ((a,b,fh), respectively) and P ((ce,i,j), respectively) mice. NMDAR1: sporadic immunolabelled cells (arrows) are observable both in DG (a) and CA1 region (b) of C animals. A marked immunopositivity is clearly evident both in the DG and CA1 area of P mice ((ce), respectively). In the DG, clusters of heavy immunoreactive cells, arranged in well-ordered chains, are observable in the width of the GL (c), several immunolabelled cells are in the SGZ (d, arrows), and many immunoreactive neurons with large soma are detectable in the PL ((d), arrows). In the CA1 area several NMDAR1-immunopositive neurons are visible localized in the SP, often showing palely immunomarked tiny prolongations, deepening in the underneath SR ((e), arrows). mGluR2: a weak and sporadic immunoreactivity is observable both in DG (f,g) and CA1 region (h) of C animals, where rare immunolabelled cells are detected (arrows). A heavy immunopositivity is clearly evident both in the DG and CA1 area of P mice ((i,j), respectively). Some heavily immunoreactive cells are evident in the DG (i), principally localized in the width of the GL and close to the SGZ (arrows). Various immunomarked neurons are also noticeable in the PL ((i), arrows). Numerous immunopositive neurons are detectable in the SP of CA1, often characterized by immunoreactive prolongations, deepening beneath in the underlying SR (j). Light microscopy magnification: 200× (a,d,g,i); 400× (b,e,h,j); 600× ((c,f) and insert in (i)). Scale bars: 200 µM (a,d,g,i); 100 µM (b,c,e,f,h,j).
Figure 9
Figure 9
Panels (A,B): histograms displaying the quantitative evaluation of NMDAR1- and mGluR2-immunopositive cell density and OD, respectively, measured in DG and CA1 area of C and P mice. p values calculated by unpaired Student’s t-test: p < 0.05 (*), p < 0.01 (**), and p < 0.001 (***).
Figure 10
Figure 10
Pictographic drawing summarizing main findings and take-home message.

Similar articles

Cited by

References

    1. van Rossum I.A., Vos S., Handels R., Visser P.J. Biomarkers as Predictors for Conversion from Mild Cognitive Impairment to Alzheimer-Type Dementia: Implications for Trial Design. J. Alzheimers Dis. 2010;20:881–891. doi: 10.3233/JAD-2010-091606. - DOI - PubMed
    1. Albert M.S. Changes in Cognition. Neurobiol. Aging. 2011;32((Suppl. S1)):S58–S63. doi: 10.1016/j.neurobiolaging.2011.09.010. - DOI - PMC - PubMed
    1. Magnusson K., Sehlin D., Syvänen S., Svedberg M.M., Philipson O., Söderberg L., Tegerstedt K., Holmquist M., Gellerfors P., Tolmachev V., et al. Specific Uptake of an Amyloid-β Protofibril-Binding Antibody-Tracer in AβPP Transgenic Mouse Brain. J. Alzheimers Dis. 2013;37:29–40. doi: 10.3233/JAD-130029. - DOI - PubMed
    1. Bird C.M. The Role of the Hippocampus in Recognition Memory. Cortex. 2017;93:155–165. doi: 10.1016/j.cortex.2017.05.016. - DOI - PubMed
    1. Gasiorowska A., Wydrych M., Drapich P., Zadrozny M., Steczkowska M., Niewiadomski W., Niewiadomska G. The Biology and Pathobiology of Glutamatergic, Cholinergic, and Dopaminergic Signaling in the Aging Brain. Front. Aging Neurosci. 2021;13:654931. doi: 10.3389/fnagi.2021.654931. - DOI - PMC - PubMed