. 2023 Jan 28;12(2):199.
doi: 10.3390/biology12020199.

Tenascin C in Lung Diseases

Affiliations

Tenascin C in Lung Diseases

Chantal Donovan et al. Biology (Basel). .

Abstract

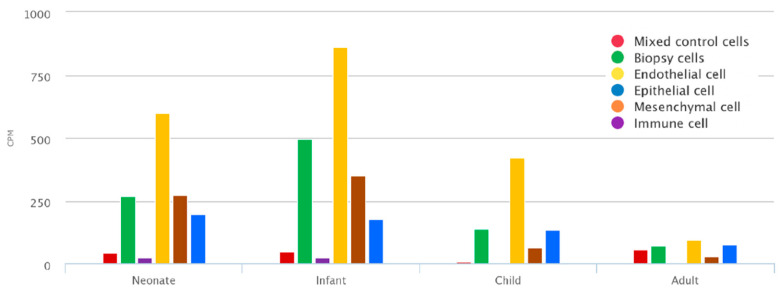
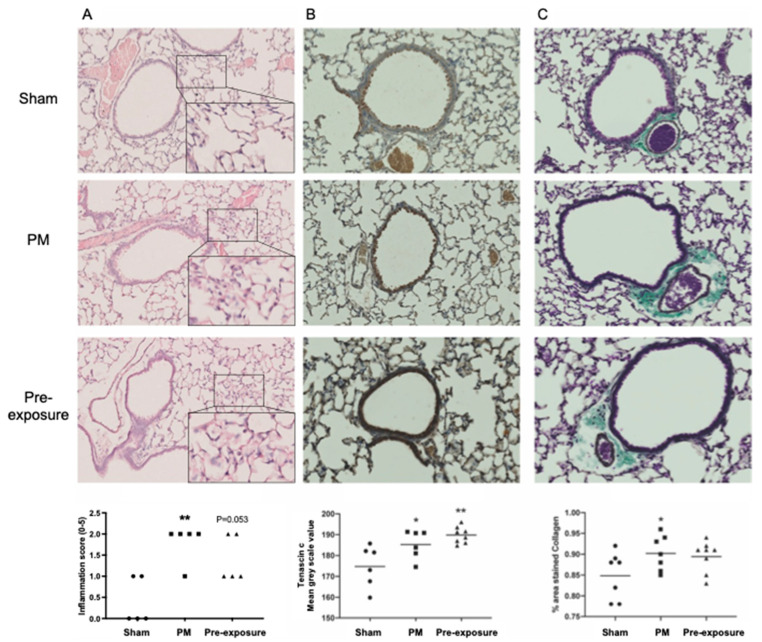
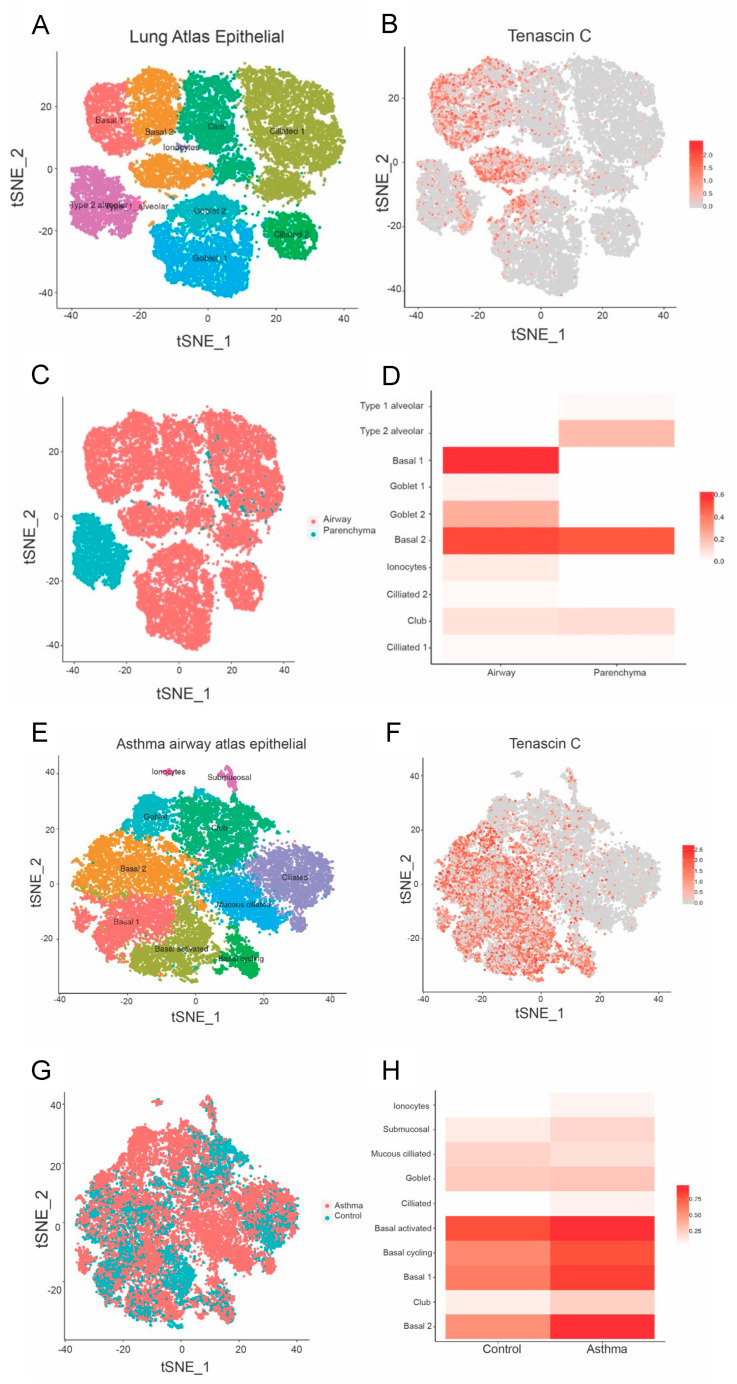
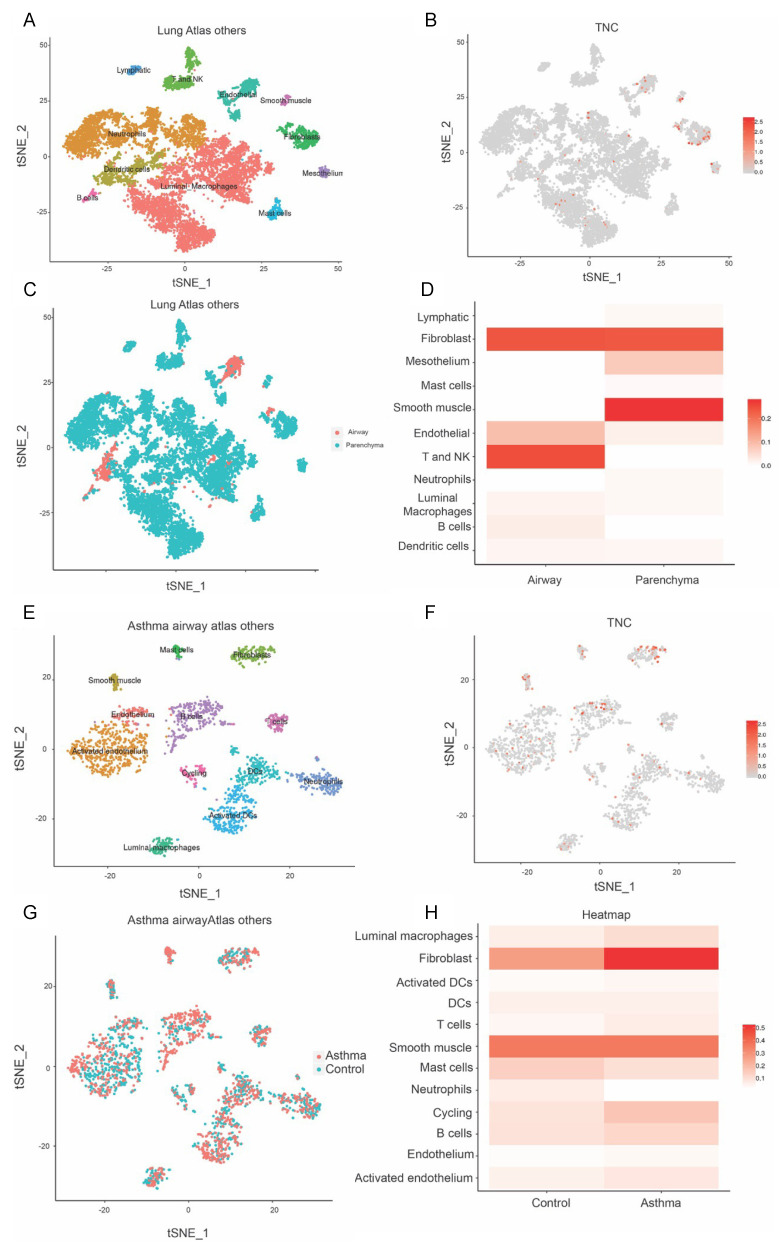
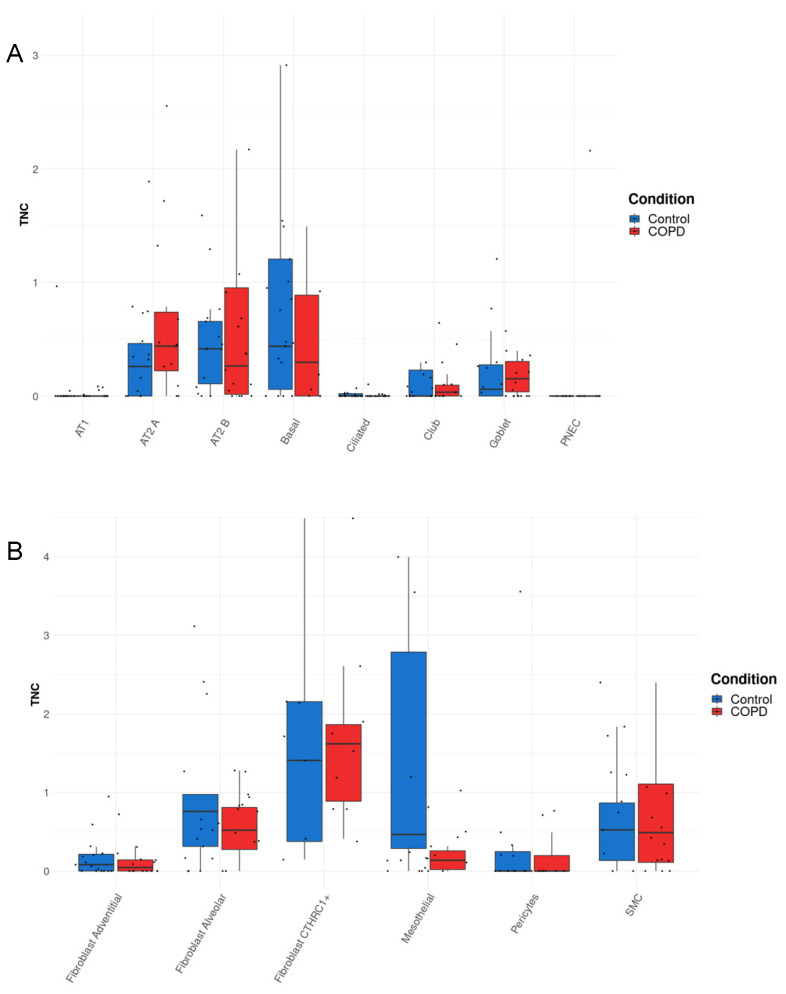
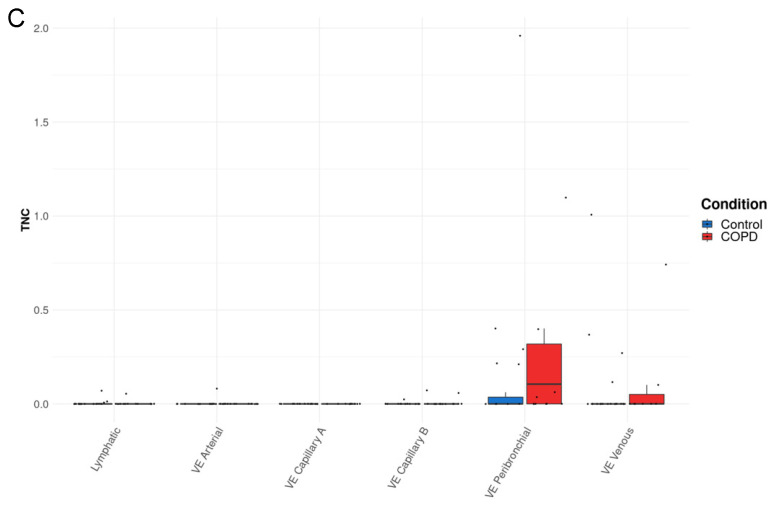
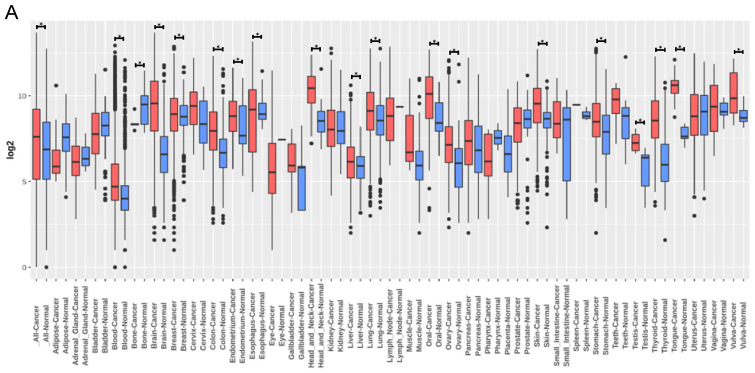
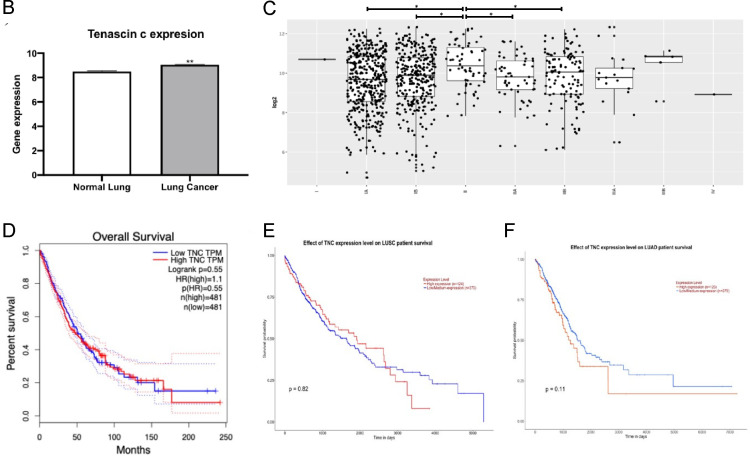
Tenascin C (TNC) is a multifunctional large extracellular matrix protein involved in numerous cellular processes in embryonic development and can be increased in disease, or under conditions of trauma or cell stress in adults. However, the role of TNC in lung diseases remains unclear. In this study, we investigated the expression of TNC during development, in offspring following maternal particulate matter (PM) exposure, asthma, chronic obstructive pulmonary disease (COPD) and lung cancer. TNC expression is increased during lung development in biopsy cells, endothelial cells, mesenchymal cells, and epithelial cells. Maternal PM exposure increased TNC and collagen deposition, which was not affected by the removal of PM exposure after pregnancy. TNC expression was also increased in basal epithelial cells and fibroblasts in patients with asthma and AT2 and endothelial cells in patients with COPD. Furthermore, there was an increase in the expression of TNC in stage II compared to stage IA lung cancer; however, overall survival analysis showed no correlation between levels of TNC and survival. In conclusion, TNC is increased during lung development, in offspring following maternal PM exposure, and in asthma, COPD, and lung cancer tissues. Therefore, targeting TNC may provide a novel therapeutic target for lung diseases.

Keywords: COPD; asthma; foetal programming; lung cancer; lung development; particular matter.


Conflict of interest statement

The authors declare no conflict of interest.

Figures

Figure 1
Figure 1
TNC is increased during early life lung development. Mean expression of TNC at different developmental stages (neonates (up to 30 days), infant (>30 days and <1 year), child (>=1 year and <10 years), and adult (>20 years)) in endothelial cells, epithelial cells, immune cells, mesenchymal cells (defined as CD140+ matrix fibroblasts, myofibroblast/smooth muscle, pericyte, proliferative mesenchymal progenitor, and intermediate fibroblasts), presort stained mixed control and biopsy samples. Data generated from https://research.cchmc.org/pbge/lunggens/mainportal.html (accessed on 1 Novmber 2022) CPM: count per million reads mapped.
Figure 2
Figure 2
TNC is increased in offspring from PM-exposed dams. (AC) Representative images of lung sections in male offspring at 13 weeks. (A) Hematoxylin and eosin staining and analysis, n = 5. (B) TNC immunohistochemistry and analysis, n = 6–8. (C) Masson’s Trichrome staining and analysis, n = 7–8. * p < 0.05, ** p < 0.01 vs. sham. PM: particulate matter.
Figure 3
Figure 3
TNC expression is increased in basal epithelial cells compared to parenchyma in healthy airways, and in asthmatic samples compared to healthy controls. (AD) Single-cell RNA sequencing clustering analysis in healthy samples generated from https://asthma.cellgeni.sanger.ac.uk/ (accessed on 1 Novmber 2022). (A) Data from the epithelial lung atlas showing lung cell distribution. (B) TNC distribution in different cells corresponding to lung atlas. (C) Type of lung cell distribution in airway and parenchyma. (D) TNC distribution in airway and parenchyma correlating to different cell types. (EG) Single-cell RNA sequencing clustering analysis in asthma airway. (E) Asthma airway atlas epithelial showing abundance of different types of lung cell distribution in asthmatic patients. (F) TNC distribution in different epithelial cells in asthmatic patients. (G) Epithelial cell distribution in asthmatic and control patients. (H) TNC distribution in control and asthmatic patients.
Figure 4
Figure 4
TNC expression is increased in fibroblasts in asthmatic samples compared to healthy controls. (AD) Single-cell RNA sequencing clustering analysis in healthy samples generated from https://asthma.cellgeni.sanger.ac.uk/ (accessed on 1 Novmber 2022). (A) Data from the lung atlas of other cells showing cell distribution. (B) TNC distribution in different cells corresponding to lung atlas. (C) Type of lung cell distribution in airway and parenchyma. (D) TNC distribution in airway and parenchyma correlating to different cell types. (EG) Single-cell RNA sequencing clustering analysis in asthma airway. (E) Asthma atlas of other cell types showing the abundance of different lung cells distribution in asthmatic patients. (F) TNC distribution in different cells in asthmatic patients. (G) Cell distribution in asthmatic and control patients. (H) TNC distribution in other cells in control and asthmatic patients.
Figure 5
Figure 5
TNC expression is increased in AT2A cells and endothelial cells (peribronchial vascular endothelial cells) in COPD compared to control lungs. (AC) TNC expression in parenchymal tissue explanted from the lung of patients with COPD or control donors generated from http://www.copdcellatlas.com (accessed on 1 Novmber 2022) [23].
Figure 5
Figure 5
TNC expression is increased in AT2A cells and endothelial cells (peribronchial vascular endothelial cells) in COPD compared to control lungs. (AC) TNC expression in parenchymal tissue explanted from the lung of patients with COPD or control donors generated from http://www.copdcellatlas.com (accessed on 1 Novmber 2022) [23].
Figure 6
Figure 6
TNC expression is increased in lung cancer, but does not correlate with lung cancer survival. (AC) TNC expression generated from http://gent2.appex.kr/gent2/ (accessed on 1 Novmber 2022) [24]. (A) TNC expression in different tissues. (B) TNC expression in normal lung (n = 508) and lung cancer (n = 2362). (C) TNC expression in different subtypes of lung cancer (I, IA, IB, II, IIA, IIB, IIIA, IIIB, IV). (D) Overall survival curve of the high and low expression of TNC in patients with lung cancer (generated from http://gepia2.cancer-pku.cn/#survival, accessed on 1 Novmber 2022) [25]. (E,F) Overall survival curve generated using Kaplan–Meier plotter (http://kmplot.com/analysis/, accessed on 1 Novmber 2022) and UALCAN (http://ualcan.path.uab.edu/, accessed on 1 Novmber 2022) (E) Overall survival curve of the high and low expression of TNC in patients with lung squamous cell carcinoma (LUSC). (F) Overall survival curve of the high and low expression of TNC in patients with lung adenocarcinoma (LUAD). * p < 0.05; ** p < 0.01 compared to normal lung. HR: hazards ratio; TPM: transcripts per million.
Figure 6
Figure 6
TNC expression is increased in lung cancer, but does not correlate with lung cancer survival. (AC) TNC expression generated from http://gent2.appex.kr/gent2/ (accessed on 1 Novmber 2022) [24]. (A) TNC expression in different tissues. (B) TNC expression in normal lung (n = 508) and lung cancer (n = 2362). (C) TNC expression in different subtypes of lung cancer (I, IA, IB, II, IIA, IIB, IIIA, IIIB, IV). (D) Overall survival curve of the high and low expression of TNC in patients with lung cancer (generated from http://gepia2.cancer-pku.cn/#survival, accessed on 1 Novmber 2022) [25]. (E,F) Overall survival curve generated using Kaplan–Meier plotter (http://kmplot.com/analysis/, accessed on 1 Novmber 2022) and UALCAN (http://ualcan.path.uab.edu/, accessed on 1 Novmber 2022) (E) Overall survival curve of the high and low expression of TNC in patients with lung squamous cell carcinoma (LUSC). (F) Overall survival curve of the high and low expression of TNC in patients with lung adenocarcinoma (LUAD). * p < 0.05; ** p < 0.01 compared to normal lung. HR: hazards ratio; TPM: transcripts per million.
Figure 7
Figure 7
Analysis of neighbouring gene networks in lung cancer. (A) The gene–gene interaction network of TNC constructed using GeneMania. (B) The protein–protein interaction network of TNC generated using STRING.

References

    1. Bradshaw A.D. Principles of Tissue Engineering. Elsevier; Amsterdam, The Netherlands: 2014. Regulation of cell behavior by extracellular proteins; pp. 279–290.
    1. Koch M., Wehrle-Haller B., Baumgartner S., Spring J., Brubacher D., Chiquet M. Epithelial synthesis of tenascin at tips of growing bronchi and graded accumulation in basement membrane and mesenchyme. Exp. Cell Res. 1991;194:297–300. doi: 10.1016/0014-4827(91)90368-5. - DOI - PubMed
    1. Midwood K.S., Chiquet M., Tucker R.P., Orend G. Tenascin-C at a glance. J. Cell Sci. 2016;129:4321–4327. doi: 10.1242/jcs.190546. - DOI - PubMed
    1. Swindle C.S., Tran K.T., Johnson T.D., Banerjee P., Mayes A.M., Griffith L., Wells A. Epidermal growth factor (EGF)-like repeats of human tenascin-C as ligands for EGF receptor. J. Cell Biol. 2001;154:459–468. doi: 10.1083/jcb.200103103. - DOI - PMC - PubMed
    1. Mercado M.L., Nur-e-Kamal A., Liu H.Y., Gross S.R., Movahed R., Meiners S. Neurite outgrowth by the alternatively spliced region of human tenascin-C is mediated by neuronal alpha7beta1 integrin. J. Neurosci. 2004;24:238–247. doi: 10.1523/JNEUROSCI.4519-03.2004. - DOI - PMC - PubMed

LinkOut - more resources