

Overview of Optical Biosensors for Early Cancer Detection: Fundamentals, Applications and Future Perspectives
- PMID: 36829508
- PMCID: PMC9953566
- DOI: 10.3390/biology12020232
Overview of Optical Biosensors for Early Cancer Detection: Fundamentals, Applications and Future Perspectives
Abstract
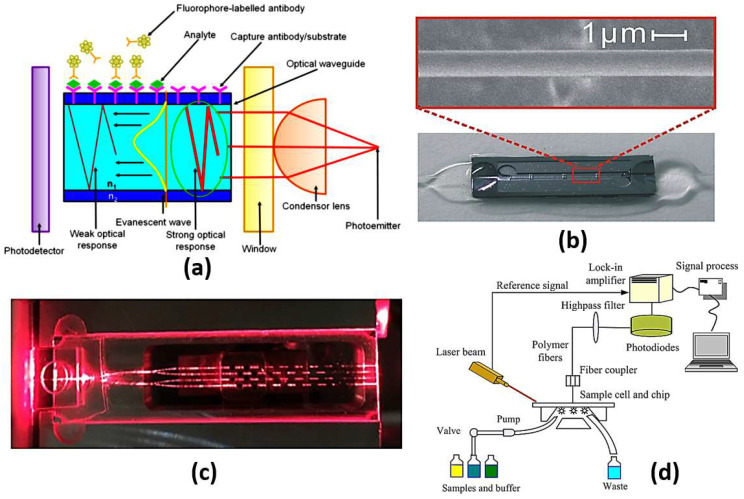
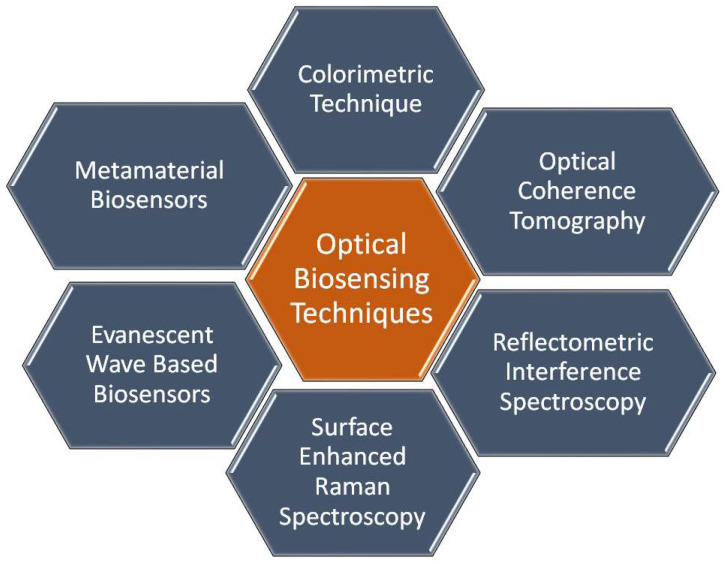
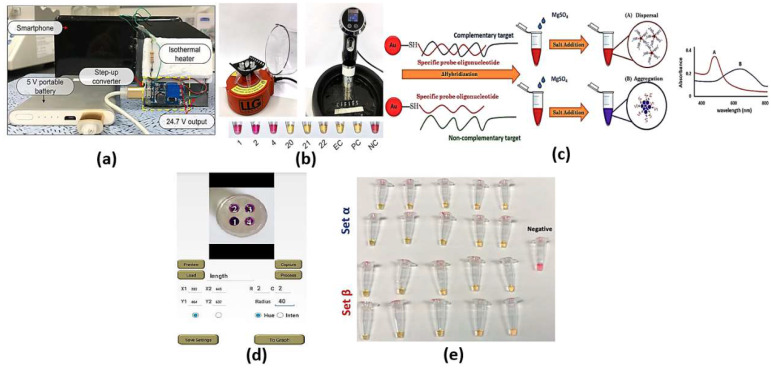
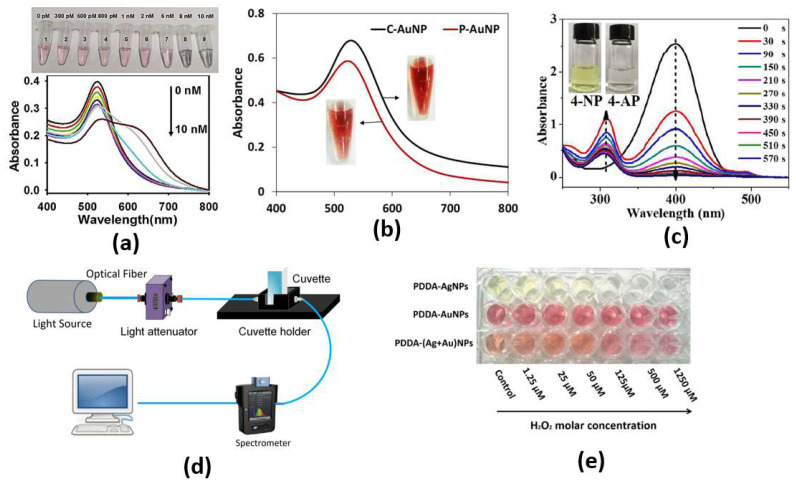
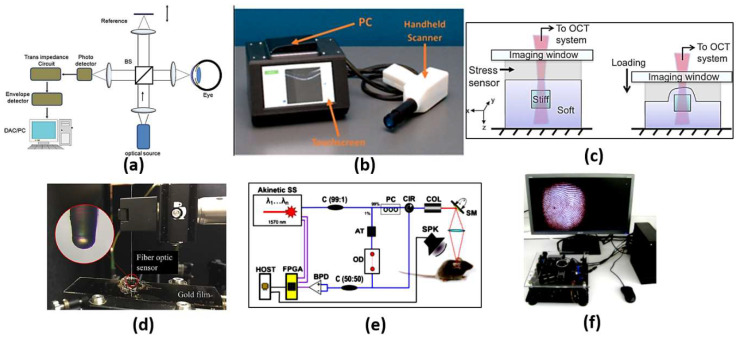
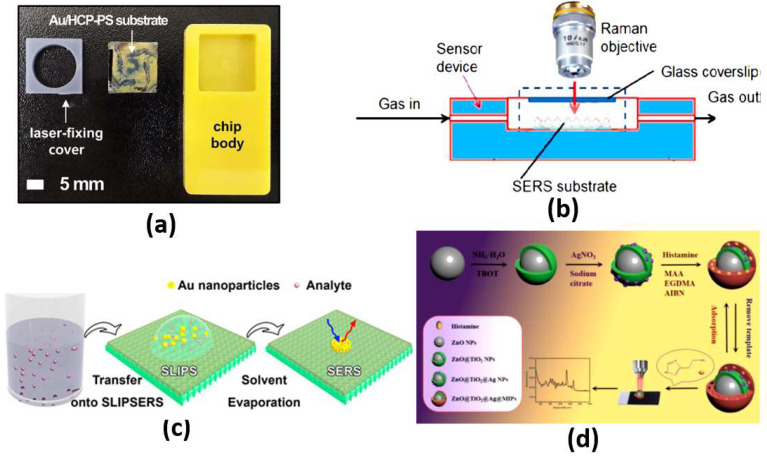
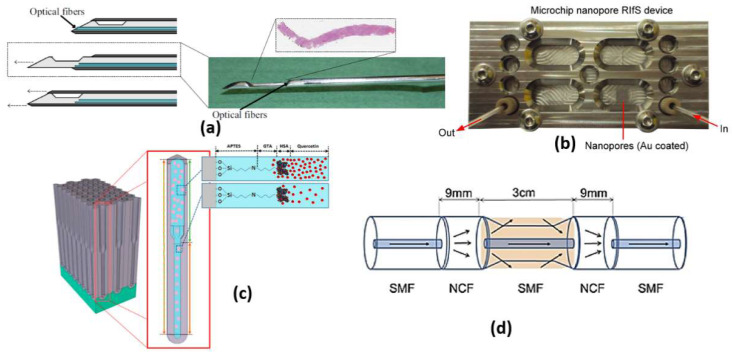
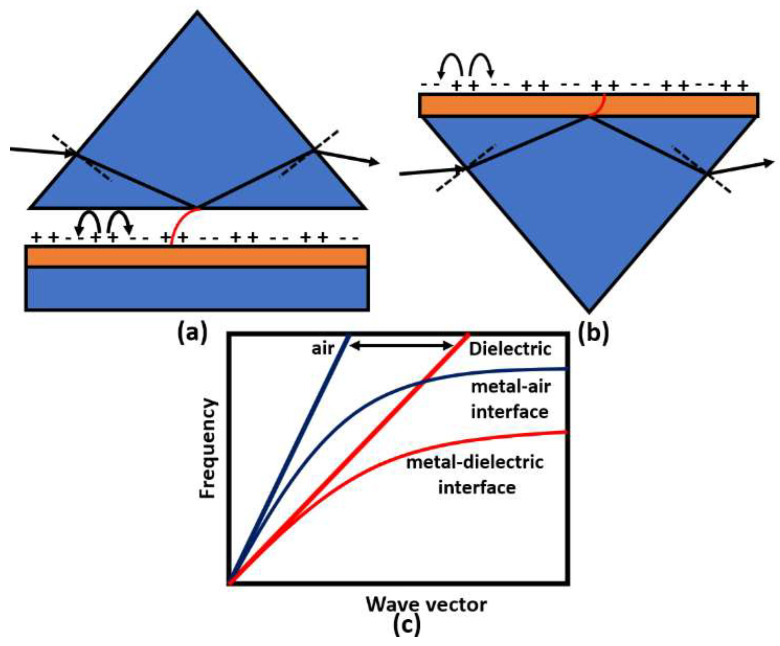
Conventional cancer detection and treatment methodologies are based on surgical, chemical and radiational processes, which are expensive, time consuming and painful. Therefore, great interest has been directed toward developing sensitive, inexpensive and rapid techniques for early cancer detection. Optical biosensors have advantages in terms of high sensitivity and being label free with a compact size. In this review paper, the state of the art of optical biosensors for early cancer detection is presented in detail. The basic idea, sensitivity analysis, advantages and limitations of the optical biosensors are discussed. This includes optical biosensors based on plasmonic waveguides, photonic crystal fibers, slot waveguides and metamaterials. Further, the traditional optical methods, such as the colorimetric technique, optical coherence tomography, surface-enhanced Raman spectroscopy and reflectometric interference spectroscopy, are addressed.
Keywords: early cancer detection; label free; metamaterial; optical biosensors; plasmonic biosensor.
Conflict of interest statement
The authors declare no conflict of interest.
Figures
Similar articles
-
Recent advancements in optical biosensors for cancer detection.Biosens Bioelectron. 2022 Feb 1;197:113805. doi: 10.1016/j.bios.2021.113805. Epub 2021 Nov 15. Biosens Bioelectron. 2022. PMID: 34801795 Review.
-
Microscopies Enabled by Photonic Metamaterials.Sensors (Basel). 2022 Jan 30;22(3):1086. doi: 10.3390/s22031086. Sensors (Basel). 2022. PMID: 35161831 Free PMC article. Review.
-
Plasmonic Metamaterials for Nanochemistry and Sensing.Acc Chem Res. 2019 Nov 19;52(11):3018-3028. doi: 10.1021/acs.accounts.9b00325. Epub 2019 Nov 4. Acc Chem Res. 2019. PMID: 31680511
-
Optical biosensors.Essays Biochem. 2016 Jun 30;60(1):91-100. doi: 10.1042/EBC20150010. Essays Biochem. 2016. PMID: 27365039 Free PMC article. Review.
-
Recent advances in the metamaterial-inspired biosensors.Biosens Bioelectron. 2018 Oct 15;117:398-402. doi: 10.1016/j.bios.2018.06.031. Epub 2018 Jun 20. Biosens Bioelectron. 2018. PMID: 29960850
Cited by
-
Design and validation of ultra-compact metamaterial-based biosensor for non-invasive cervical cancer diagnosis in terahertz regime.PLoS One. 2025 Feb 3;20(2):e0311431. doi: 10.1371/journal.pone.0311431. eCollection 2025. PLoS One. 2025. PMID: 39899558 Free PMC article.
-
Recent advances in the metamaterial and metasurface-based biosensor in the gigahertz, terahertz, and optical frequency domains.Heliyon. 2024 Jun 21;10(13):e33272. doi: 10.1016/j.heliyon.2024.e33272. eCollection 2024 Jul 15. Heliyon. 2024. PMID: 39040247 Free PMC article. Review.
-
Challenges in Adapting Fibre Optic Sensors for Biomedical Applications.Biosensors (Basel). 2025 May 13;15(5):312. doi: 10.3390/bios15050312. Biosensors (Basel). 2025. PMID: 40422051 Free PMC article. Review.
-
Design and Fabrication of a Novel Corona-Shaped Metamaterial Biosensor for Cancer Cell Detection.Micromachines (Basel). 2023 Nov 18;14(11):2114. doi: 10.3390/mi14112114. Micromachines (Basel). 2023. PMID: 38004971 Free PMC article.
-
Inverted Pyramid Nanostructures Coupled with a Sandwich Immunoassay for SERS Biomarker Detection.Nanomaterials (Basel). 2025 Jan 2;15(1):64. doi: 10.3390/nano15010064. Nanomaterials (Basel). 2025. PMID: 39791822 Free PMC article.
References
-
- National Cancer Institute. [(accessed on 20 April 2022)]; Available online: https://www.cancer.gov/about-cancer/understanding/statistics.
-
- Sinha T. Tumors: Benign and Malignant. Cancer Ther. Oncol. Int. J. 2018;10:555790. doi: 10.19080/CTOIJ.2018.10.555790. - DOI
Publication types
Grants and funding
LinkOut - more resources
Full Text Sources
