

Aptasensor for the Detection of Moraxella catarrhalis Adhesin UspA2
- PMID: 36829672
- PMCID: PMC9951875
- DOI: 10.3390/bioengineering10020178
Aptasensor for the Detection of Moraxella catarrhalis Adhesin UspA2
Abstract
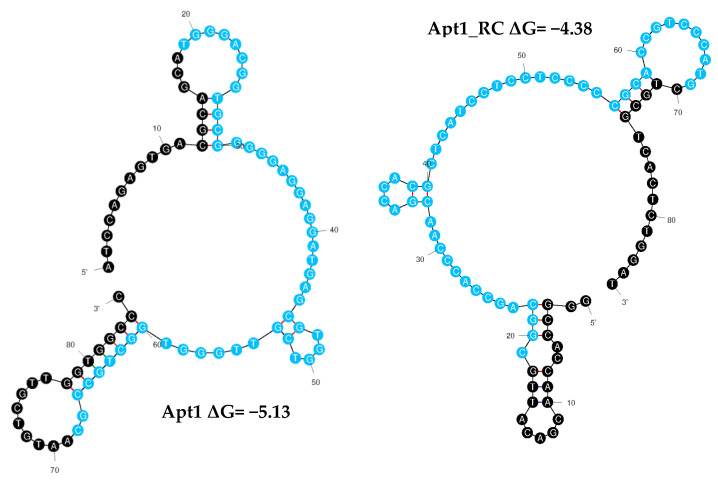
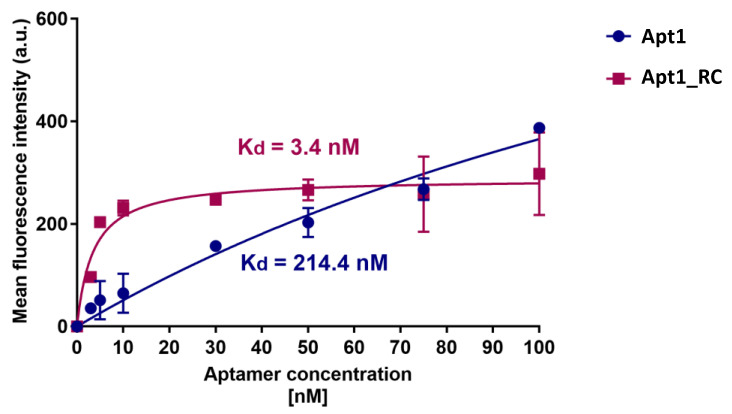
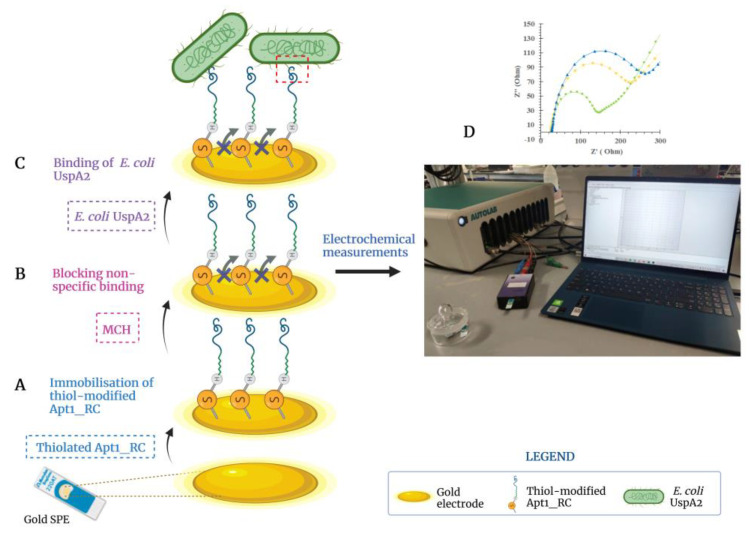
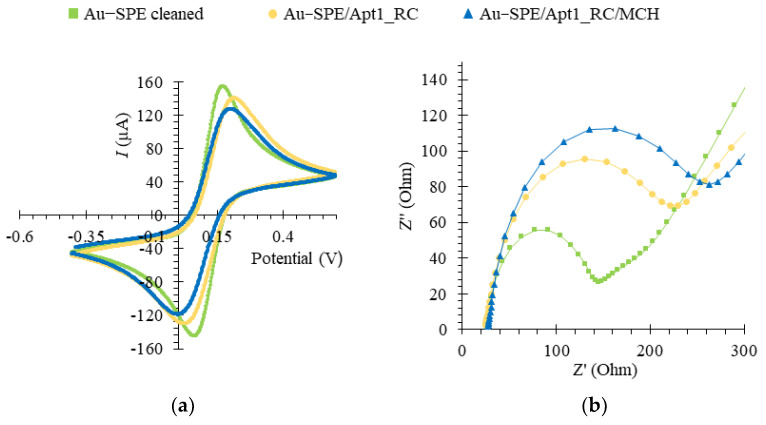
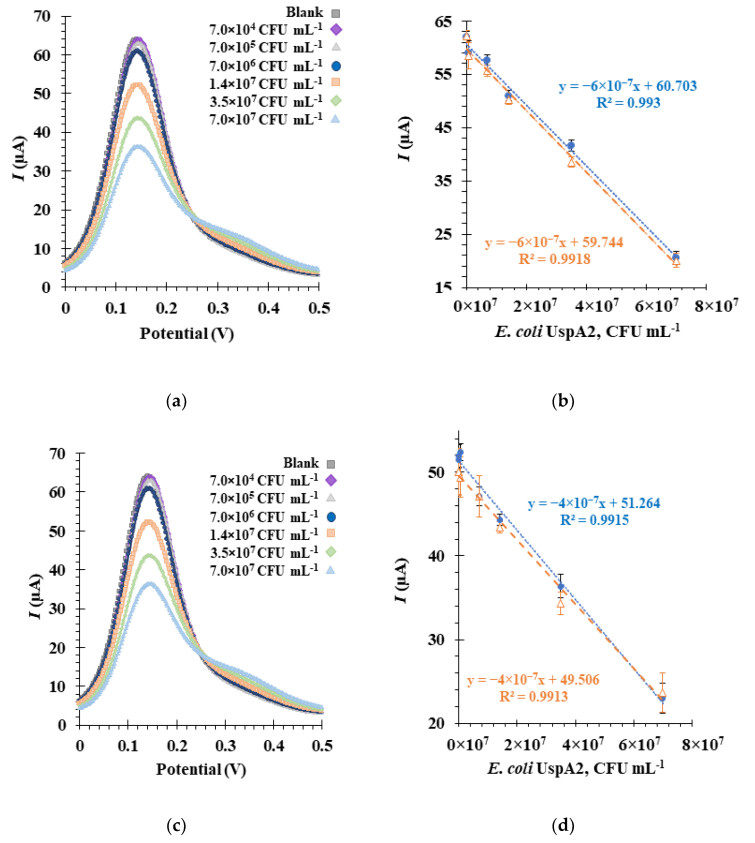
Innovative point-of-care (PoC) diagnostic platforms are desirable to surpass the deficiencies of conventional laboratory diagnostic methods for bacterial infections and to tackle the growing antimicrobial resistance crisis. In this study, a workflow was implemented, comprising the identification of new aptamers with high affinity for the ubiquitous surface protein A2 (UspA2) of the bacterial pathogen Moraxella catarrhalis and the development of an electrochemical biosensor functionalized with the best-performing aptamer as a bioreceptor to detect UspA2. After cell-systematic evolution of ligands by exponential enrichment (cell-SELEX) was performed, next-generation sequencing was used to sequence the final aptamer pool. The most frequent aptamer sequences were further evaluated using bioinformatic tools. The two most promising aptamer candidates, Apt1 and Apt1_RC (Apt1 reverse complement), had Kd values of 214.4 and 3.4 nM, respectively. Finally, a simple and label-free electrochemical biosensor was functionalized with Apt1_RC. The aptasensor surface modifications were confirmed by impedance spectroscopy and cyclic voltammetry. The ability to detect UspA2 was evaluated by square wave voltammetry, exhibiting a linear detection range of 4.0 × 10⁴-7.0 × 10⁷ CFU mL-1, a square correlation coefficient superior to 0.99 and a limit of detection of 4.0 × 10⁴ CFU mL-1 at pH 5.0. The workflow described has the potential to be part of a sensitive PoC diagnostic platform to detect and quantify M. catarrhalis from biological samples.
Keywords: adhesins; aptamers; biosensor; cell-SELEX; detection; electrochemical; outer membrane proteins (OMPs); point-of-care (PoC); ubiquitous surface protein A2 (UspA2).
Conflict of interest statement
The authors declare no conflict of interest.
Figures
Similar articles
-
Electrochemical Aptasensor for the Detection of the Key Virulence Factor YadA of Yersinia enterocolitica.Biosensors (Basel). 2022 Aug 8;12(8):614. doi: 10.3390/bios12080614. Biosensors (Basel). 2022. PMID: 36005012 Free PMC article.
-
The emerging pathogen Moraxella catarrhalis interacts with complement inhibitor C4b binding protein through ubiquitous surface proteins A1 and A2.J Immunol. 2004 Oct 1;173(7):4598-606. doi: 10.4049/jimmunol.173.7.4598. J Immunol. 2004. PMID: 15383594
-
Vitronectin binds to the head region of Moraxella catarrhalis ubiquitous surface protein A2 and confers complement-inhibitory activity.Mol Microbiol. 2010 Mar;75(6):1426-44. doi: 10.1111/j.1365-2958.2010.07066.x. Epub 2010 Feb 19. Mol Microbiol. 2010. PMID: 20199596
-
Vaccines for Moraxella catarrhalis.Vaccine. 2000 Dec 8;19 Suppl 1:S101-7. doi: 10.1016/s0264-410x(00)00287-5. Vaccine. 2000. PMID: 11163472 Review.
-
MID and UspA1/A2 of the human respiratory pathogen Moraxella catarrhalis, and interactions with the human host as basis for vaccine development.Acta Biochim Pol. 2006;53(3):445-56. Epub 2006 Sep 9. Acta Biochim Pol. 2006. PMID: 16964325 Review.
Cited by
-
Rapid and reliable diagnosis of Moraxella catarrhalis infection using loop-mediated isothermal amplification-based testing.Front Bioeng Biotechnol. 2024 Jan 8;11:1330047. doi: 10.3389/fbioe.2023.1330047. eCollection 2023. Front Bioeng Biotechnol. 2024. PMID: 38260738 Free PMC article.
References
-
- Hays J.P. Moraxella catarrhalis: A mini review. J. Pediatr. Infect. Dis. 2009;4:211–220. doi: 10.3233/JPI-2009-0167. - DOI
-
- Sillanpää S., Oikarinen S., Sipilä M., Kramna L., Rautiainen M., Huhtala H., Aittoniemi J., Laranne J., Hyöty H., Cinek O. Moraxella catarrhalis Might Be More Common than Expected in Acute Otitis Media in Young Finnish Children. J. Clin. Microbiol. 2016;54:2373–2379. doi: 10.1128/JCM.01146-16. - DOI - PMC - PubMed
Grants and funding
LinkOut - more resources
Full Text Sources
Research Materials
Miscellaneous
