. 2023 Feb 16;10(2):263.
doi: 10.3390/bioengineering10020263.

An In Vivo Platform for Rebuilding Functional Neocortical Tissue

Affiliations

An In Vivo Platform for Rebuilding Functional Neocortical Tissue

Alexandra Quezada et al. Bioengineering (Basel). .

Abstract

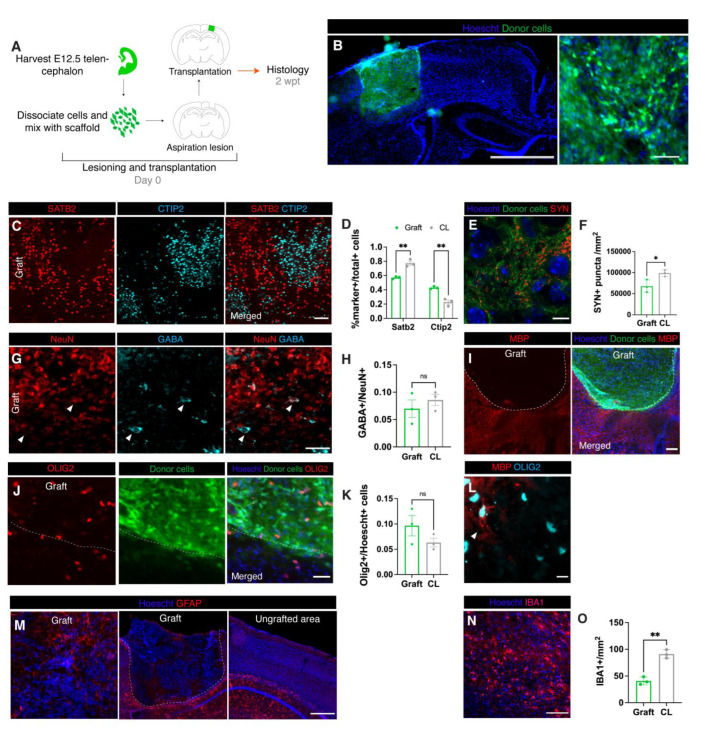
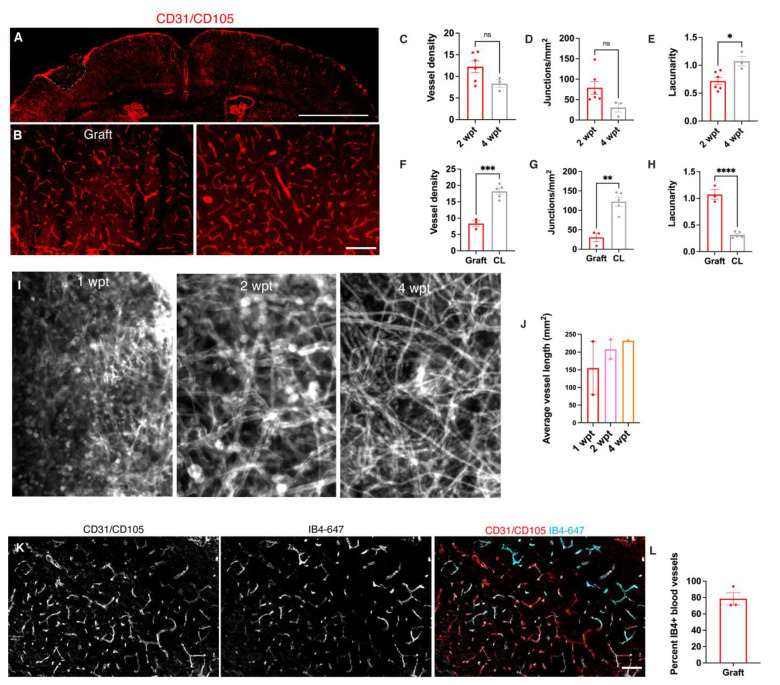
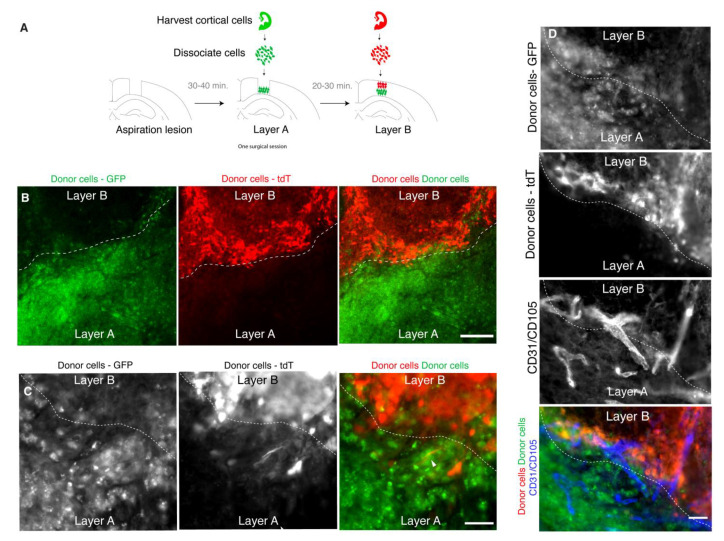
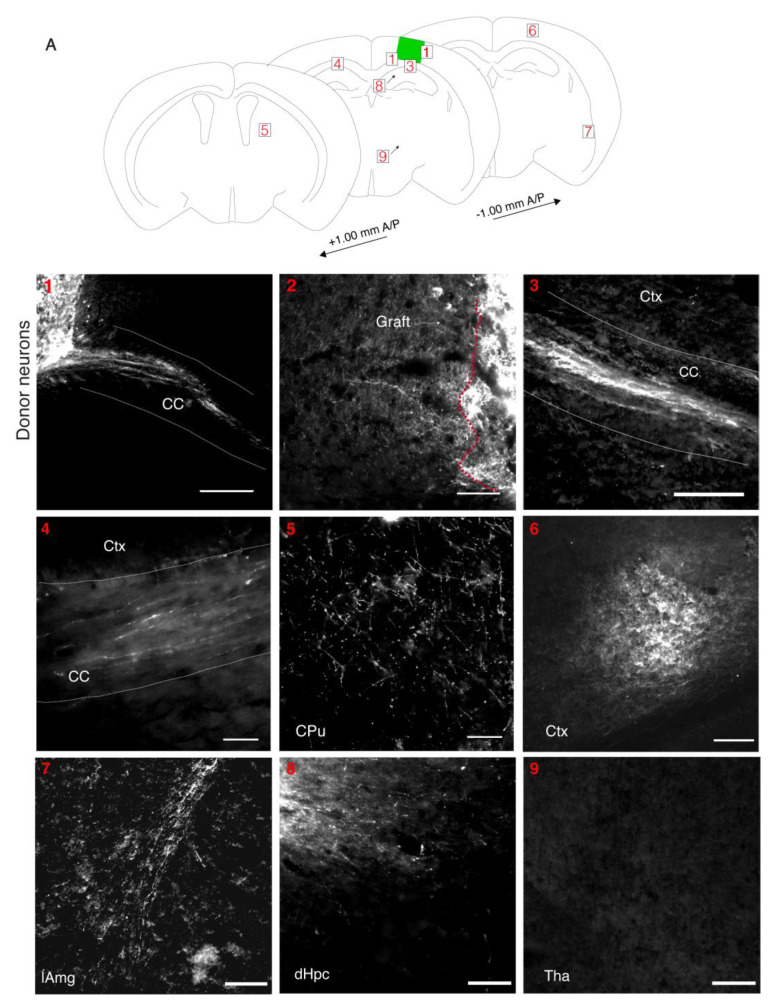
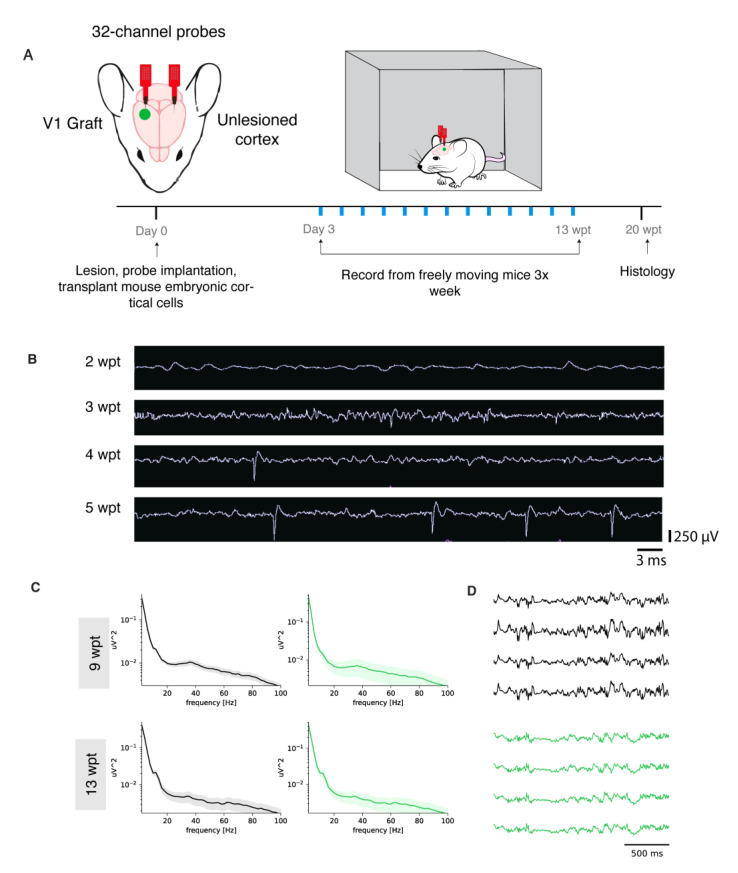
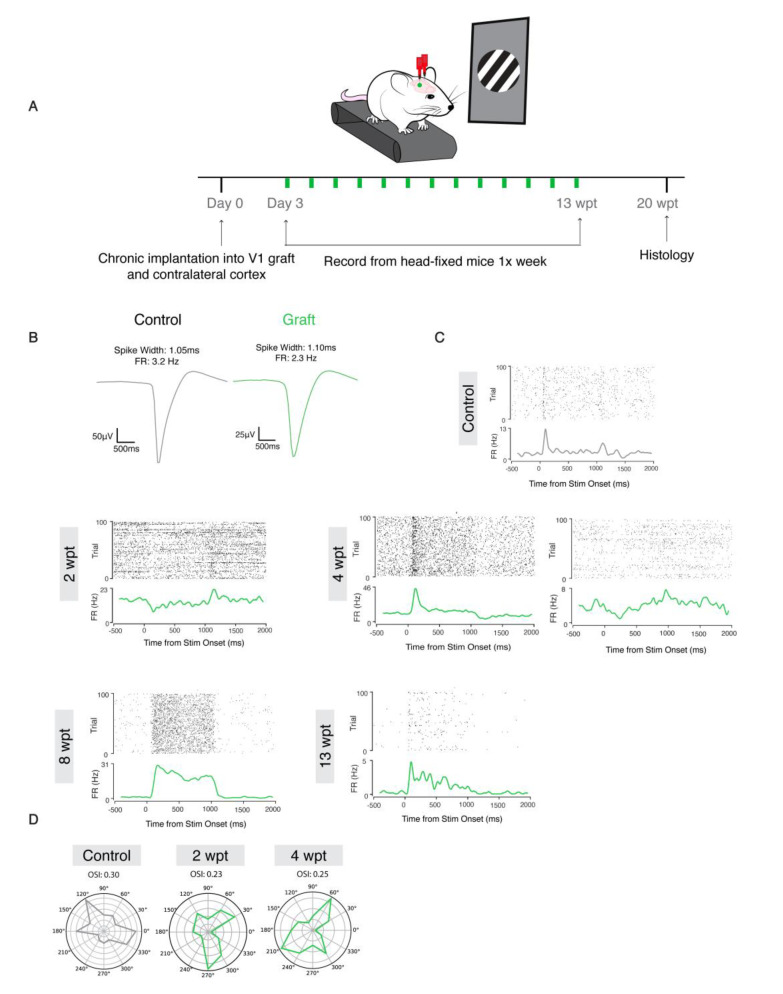
Recent progress in cortical stem cell transplantation has demonstrated its potential to repair the brain. However, current transplant models have yet to demonstrate that the circuitry of transplant-derived neurons can encode useful function to the host. This is likely due to missing cell types within the grafts, abnormal proportions of cell types, abnormal cytoarchitecture, and inefficient vascularization. Here, we devised a transplant platform for testing neocortical tissue prototypes. Dissociated mouse embryonic telencephalic cells in a liquid scaffold were transplanted into aspiration-lesioned adult mouse cortices. The donor neuronal precursors differentiated into upper and deep layer neurons that exhibited synaptic puncta, projected outside of the graft to appropriate brain areas, became electrophysiologically active within one month post-transplant, and responded to visual stimuli. Interneurons and oligodendrocytes were present at normal densities in grafts. Grafts became fully vascularized by one week post-transplant and vessels in grafts were perfused with blood. With this paradigm, we could also organize cells into layers. Overall, we have provided proof of a concept for an in vivo platform that can be used for developing and testing neocortical-like tissue prototypes.

Keywords: layering; neocortex; tissue replacement; transplant; vascularization.


Conflict of interest statement

J.M.H. is Founder of BE Therapeutics Inc., a company aimed at brain tissue repair. There are no other conflicts to report.

Figures

Figure 1
Figure 1
Transplanted embryonic cells in matrix differentiate at the site of aspiration lesions. (A): Experimental design. (B): Representative immunofluorescence image of transplant at 2 wpt at low (left; scale bar = 1550 μM) and high (right; scale bar = 100 μM) magnification. (C): Representative immunofluorescence image of upper (SATB2) and deeper (CTIP2) cortical neurons in a graft (scale bar = 100 μM). (D): Proportion of cells positive for cortical layer markers (SATB2: graft 57% of total SATB2 and CTIP2-labeled cells, N = 3; contralateral cortex 77%, N = 3, p = 0.003; CTIP2: graft 43%, N = 3; contralateral cortex 23% p = 0.003). (E): Representative immunofluorescence image of anti-SYN staining (synapses) in a graft (scale bar = 5 μM). (F): Density of anti-SYN fluorescence (graft 67,610 SYN+ puncta/mm2, N = 3; contralateral cortex 98,886 SYN+ puncta/mm2, N = 3, p = 0.03). (G): Representative immunofluorescence image of mature neurons and inhibitory neurons (scale bar = 50 μM). Triangles indicate NeuN+/GABA+ cells. (H): Quantification of inhibitory neurons (GABA) out of total mature neurons (NeuN) (graft: 7% GABA+ out of total NeuN+ cells, N = 3; contralateral cortex, 9% GABA+, N = 3, p = 0.45). (I): Representative immunofluorescence image of myelin along the graft host border (dotted line) (scale bar = 200 μM). (J): Representative immunofluorescence image of OLIG2+ oligodendrocyte lineage cells along the graft host border (dotted line) (scale bar= 50 μM). (K): Quantification of OLIG2+/Hoescht+ cells (graft 9.7%, N = 3, contralateral cortex 6.3% N = 3, p = 0.2). (L): Representative immunofluorescence image of a rare myelin (MBP)-positive oligodendrocyte in a graft (scale = 20 μM). Triangle indicates a myelinated OLIG2+ cell. (M): Representative immunofluorescence images of astrocytes in a graft and contralateral cortex. Dotted line indicates outline of graft (scale bar = 500 μM). (N): Representative immunofluorescence image of IBA1+ cells in a graft (scale bar = 100 μM). (O): Density of IBA1+ cells (graft 40.8/mm2 N = 3, contralateral cortex 91.1/mm2, p = 0.21) *, p ≤ 0.05; **, p ≤ 0.01.
Figure 2
Figure 2
Grafts become functionally vascularized. (A): Representative immunofluorescence image of vascularized cortex with graft (dotted line) at 2 wpt (scale bar = 2 mm). (B): High magnification images of graft and contralateral cortex (scale bar = 200 μM). (CE). Analysis of vasculature between grafts at 2 and 4 wpt. (C): Blood vessel density (2 wpt 12.2% vessel area over total area, N = 6; 4 wpt 8.3%, N = 3, p = 0.1). (D): Junction and branch point density (2 wpt, 79/mm2, N = 6; 4 wpt, 30.1/mm2, N = 3, p = 0.08). (E): Lacunarity (2 wpt, 0.72, N = 6; 4 wpt, 1.1, N = 3, p = 0.02). (F–H). Analysis of vasculature between 4 wpt grafts and contralateral cortex. (F): Blood vessel density (graft, 8.3% vessel area over total area, N = 3; contralateral cortex 18.2 %, N = 5, p = 0.0004). (G): Junction and branch point density (graft 30.6/mm2, N = 3; contralateral cortex 122.4 N = 5, p = 0.02). (H): Lacunarity (graft lacunarity = 1.1, N =3; contralateral cortex 0.3, N = 5, p < 0.0001). (I): Representative 2-photon images of flattened Z-stacks of grafts at 1, 2, and 4 wpt. (J): Average vessel length (1 wpt 154.2 mm2, N = 2; 2 wpt 208.2 mm2, N = 2; 4 wpt 232.4 mm2, N = 1). (K): Representative immunofluorescence image after systemic perfusion with IB4 in a graft co-stained with total vessels (Scale bar = 200 μM). (L): Percentage of IB4+ vessels in grafts normalized to total vessels (78.5 % IB4+ vessels, N = 3). *, p ≤ 0.05; **, p ≤ 0.01; ***, p ≤ 0.001; ****, p ≤ 0.0001.
Figure 3
Figure 3
Grafts can be constructed in layers. (A): Experimental design. (B): Representative immunofluorescence image of a layered transplant at 2 wpt (scale bar = 200 μM). Dotted line indicates border between the layers. (C): Example of a neuronal projection (arrowhead) crossing the border between layers (scale bar = 50 μM) already at 2 wpt. (D): Example of blood vessels that cross the border between layers (scale bar = 50 μM).
Figure 4
Figure 4
Mouse donor cells project to appropriate brain regions. (A): Diagram of areas in host brain that donor cells project to at 2 wpt. Projections are seen in (1). The corpus callosum (CC) exiting the graft (N = 6/9) (scale bar = 300 μM). (2). The cortex directly adjacent to the graft (N = 9/9) (scale bar = 80 μM). (3). The CC away from the graft towards the contralateral hemisphere (N = 6/9) (scale bar = 80 μM). (4). The CC in contralateral cortex (N = 6/9) (Scale bar = 40 μM). (5). The caudate putamen (CPu) (N = 3/9) (scale bar = 80 μM). (6). The posterior cortex (N = 2/9) (scale bar = 100 μM). (7). The lateral amygdala (lAmg) (N = 1/9) (scale bar = 200 μM). (8). The dorsal hippocampus (dHPC) (N = 2/9) (scale bar = 100 μM). (9). The thalamus (Thal) (N = 9/9) (scale bar = 100 μM).
Figure 5
Figure 5
Mouse donor neurons become physiologically active. (A): Experimental design. (B): Neural traces of a single representative channel at 2, 3, 4, and 5 wpt with the same time and voltage scales. (C): LFP power spectrums of control (left panels) and graft (right panels) at 9 and 13 wpt. (D): LFP traces of control (gray) and graft (green) at 9 and 13 wpt.
Figure 6
Figure 6
Mouse donor neurons respond to visual stimuli and are tuned to specific orientations. (A): Experimental design. (B): Representative waveforms of putative neurons from control (left:black) and graft (right:green). (C): Raster plots of firing rate and signal to noise ratio (SNR) at 2, 4, 8, and 13 wpt (from left to right, top to bottom). (D): OSI for control and graft at 2 and 4 wpt.

Similar articles

Cited by

References

    1. Linaro D., Vermaercke B., Iwata R., Ramaswamy A., Libé-Philippot B., Boubakar L., Davis B.A., Wierda K., Davie K., Poovathingal S., et al. Xenotransplanted Human Cortical Neurons Reveal Species-Specific Development and Functional Integration into Mouse Visual Circuits. Neuron. 2019;104:972–986.e6. doi: 10.1016/j.neuron.2019.10.002. - DOI - PMC - PubMed
    1. Espuny-Camacho I., Michelsen K.A., Linaro D., Bilheu A., Acosta-Verdugo S., Herpoel A., Giugliano M., Gaillard A., Vanderhaeghen P. Human Pluripotent Stem-Cell-Derived Cortical Neurons Integrate Functionally into the Lesioned Adult Murine Visual Cortex in an Area-Specific Way. Cell Rep. 2018;23:2732–2743. doi: 10.1016/j.celrep.2018.04.094. - DOI - PMC - PubMed
    1. Falkner S., Grade S., Dimou L., Conzelmann K.K., Bonhoeffer T., Götz M., Hübener M. Transplanted embryonic neurons integrate into adult neocortical circuits. Nature. 2016;539:248–253. doi: 10.1038/nature20113. - DOI - PubMed
    1. Mansour A.A., Gonçalves J.T., Bloyd C.W., Li H., Fernandes S., Quang D., Johnston S., Parylak S.L., Jin X., Gage F.H. An in vivo model of functional and vascularized human brain organoids. Nat. Biotechnol. 2018;36:432–441. doi: 10.1038/nbt.4127. - DOI - PMC - PubMed
    1. Michelsen K.A., Acosta-Verdugo S., Benoit-Marand M., Espuny-Camacho I., Gaspard N., Saha B., Gaillard A., Vanderhaeghen P. Area-specific reestablishment of damaged circuits in the adult cerebral cortex by cortical neurons derived from mouse embryonic stem cells. Neuron. 2015;85:982–997. doi: 10.1016/j.neuron.2015.02.001. - DOI - PubMed

LinkOut - more resources