. 2023 Feb 18;10(2):267.
doi: 10.3390/bioengineering10020267.

K2S Challenge: From Undersampled K-Space to Automatic Segmentation

Affiliations

K2S Challenge: From Undersampled K-Space to Automatic Segmentation

Aniket A Tolpadi et al. Bioengineering (Basel). .

Abstract

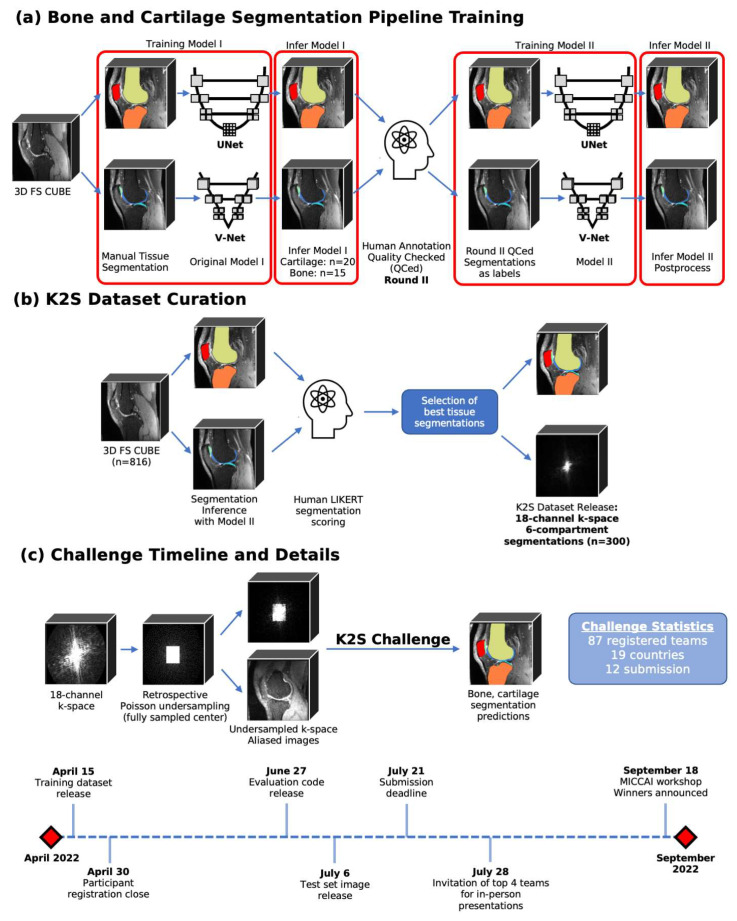
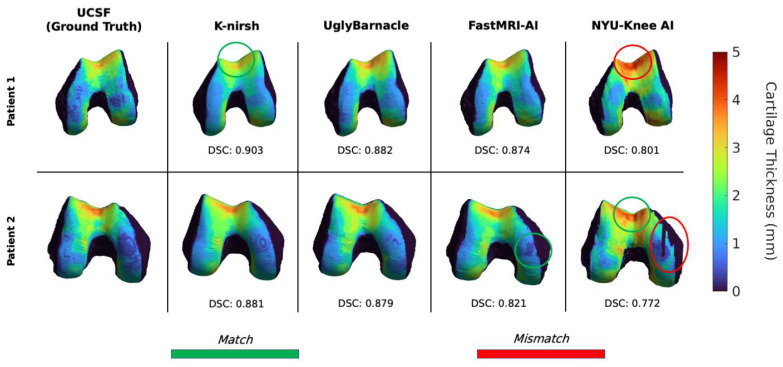
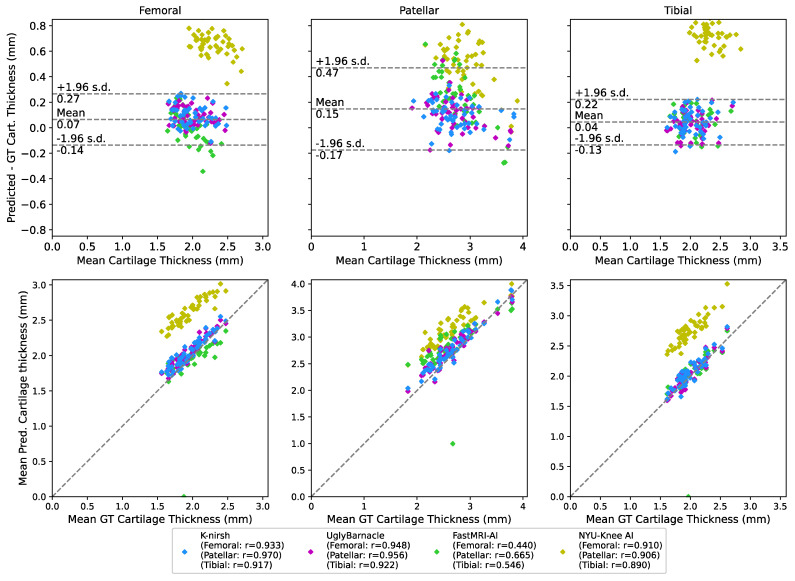
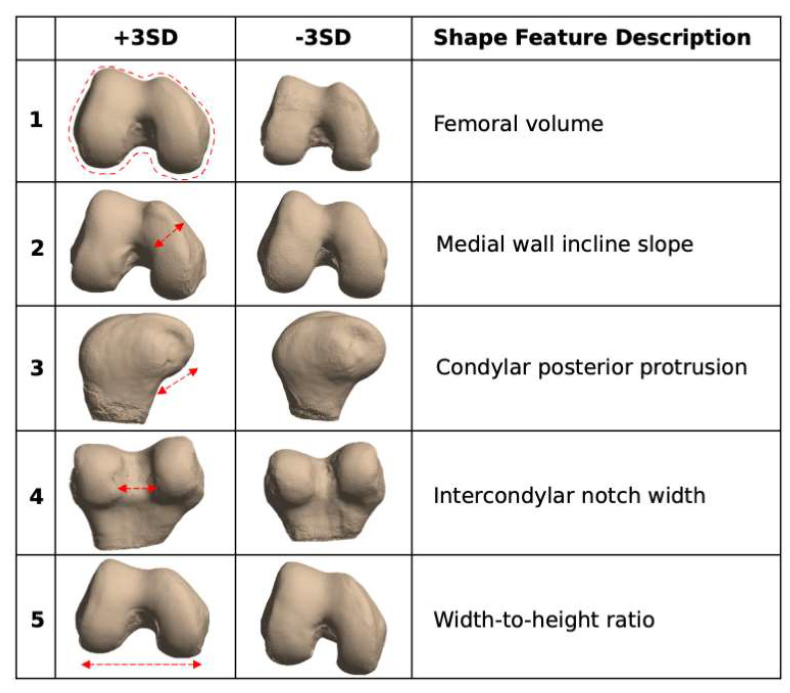
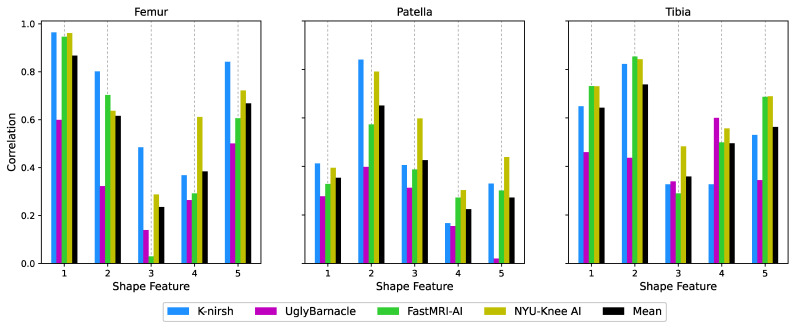
Magnetic Resonance Imaging (MRI) offers strong soft tissue contrast but suffers from long acquisition times and requires tedious annotation from radiologists. Traditionally, these challenges have been addressed separately with reconstruction and image analysis algorithms. To see if performance could be improved by treating both as end-to-end, we hosted the K2S challenge, in which challenge participants segmented knee bones and cartilage from 8× undersampled k-space. We curated the 300-patient K2S dataset of multicoil raw k-space and radiologist quality-checked segmentations. 87 teams registered for the challenge and there were 12 submissions, varying in methodologies from serial reconstruction and segmentation to end-to-end networks to another that eschewed a reconstruction algorithm altogether. Four teams produced strong submissions, with the winner having a weighted Dice Similarity Coefficient of 0.910 ± 0.021 across knee bones and cartilage. Interestingly, there was no correlation between reconstruction and segmentation metrics. Further analysis showed the top four submissions were suitable for downstream biomarker analysis, largely preserving cartilage thicknesses and key bone shape features with respect to ground truth. K2S thus showed the value in considering reconstruction and image analysis as end-to-end tasks, as this leaves room for optimization while more realistically reflecting the long-term use case of tools being developed by the MR community.

Keywords: compressed sensing; deep learning; image reconstruction; magnetic resonance imaging; multi-task learning; musculoskeletal; segmentation.


Conflict of interest statement

The authors declare no conflict of interest.

Figures

Figure 1
Figure 1
Overview of steps involved in human-in-the-loop training of models to generate ground truth bone and cartilage segmentations, and the process for radiologist approval of final 300 segmentations to be included in K2S dataset. The K2S challenge was for participants to segment knee bones and cartilage from 8× undersampled k-space, with the training set released on 15 April, the test set released on 6 July, and the submission deadline on 21 July.
Figure 2
Figure 2
k-Space and image space post-processing steps for the in-house pipeline to reconstruct DICOM images from raw scanner data. Briefly, the steps in k-space are as follows: ARC reconstruction (parallel imaging), Fermi filtration to remove Gibbs artifacts, and zero-padding to bring the image to the intended output resolution. Image-space processing included coil combination, surface coil intensity correction, and gradient coil inhomogeneity correction.
Figure 3
Figure 3
Intermediate outputs within the post-processing pipeline going from raw k-space to DICOM images. Each pane of the image reflects the output of the image after the step described by the pane title.
Figure 4
Figure 4
1–5 LIKERT cartilage segmentation scores overlaid on ground truth knee scans. In this example, the LIKERT of 5 indicates human-like segmentation; the LIKERT of 4 shows a slight underestimation of patellar and tibial cartilage; the LIKERT of 3 is assigned due to minor underestimation of patellar and tibial cartilage, with soft tissue detected as femoral cartilage; the LIKERT of 2 is assigned due to missing mask areas for patellar and tibial cartilage, with femoral cartilage overestimation; the LIKERT of 1 is missing a tibial cartilage mask.
Figure 5
Figure 5
1–5 LIKERT bone segmentation scores overlaid on ground truth knee scans. In this example, the LIKERT of 5 indicates human-like segmentation; the LIKERT of 4 shows minor missing components in the femoral bone; the LIKERT of 3 shows missing components of the patellar bone mask; the LIKERT of 2 shows major missed regions within the tibial and patellar bone; the LIKERT of 1 has patella and tibia masks misassigned.
Figure 6
Figure 6
Intermediate pipeline reconstruction outputs for each of the top 4 submissions in an example sagittal slice, as well as ground truth, with reconstruction metrics displayed for the volume including the visualized slice. For this volume, UglyBarnacle delivers the highest quality reconstruction, followed closely by NYU-Knee AI, recovering sharpness and many fine details lost to aliasing during 8× Poisson undersampling. K-nirsh delivers an intermediate reconstruction that was poor by standard reconstruction metrics, but perceptually, made boundaries between tissues much more distinct and perhaps easier to segment. This is likely due to K-nirsh fine-tuning the reconstruction and segmentation networks in an end-to-end manner, unlike other top submissions.
Figure 7
Figure 7
Sagittal slice segmentations overlaid on intermediate pipeline reconstructions, with reconstruction and segmentation metrics for the volume including the slice displayed. Background anatomy slices were thus blurrier for some teams than for others, as different teams had different quality intermediate pipeline reconstruction outputs. In this example, segmentation quality was strong for all top submissions, with only some overestimation of cartilage thickness from the NYU-Knee AI pipeline being apparent. K-nirsh maintains a slight edge over UglyBarnacle in reconstruction metrics for this volume.
Figure 8
Figure 8
Reconstruction metrics (nRMSE, PSNR, SSIM) plotted against weighted DSC for each of the top four submissions, with each point denoting a subject in the test set (n = 50). Pearson’s correlation coefficient was calculated for each pair and is displayed on the chart, indicating that at absolute best, there was a weak correlation between segmentation and reconstruction metrics, and that in most cases, there was no or even negative correlation.
Figure 9
Figure 9
Femoral cartilage thickness maps projected onto voxel-based femoral bone shapes for each of the top 4 teams, as well as ground truth. While all submissions exhibit a degree of smoothness that is not reflected in the ground truth, the top three especially were strong in preserving cartilage thicknesses (K-nirsh, UglyBarnacle, FastMRI-AI), with NYU-Knee AI slightly overestimating cartilage thicknesses but still preserving key features in some regions.
Figure 10
Figure 10
Bland-Altman and correlation plots between predicted and ground truth cartilage thicknesses for each of the top 4 submissions, across each of the 3 cartilage compartments. The mean and standard deviations for these plots were calculated using the data points from K-nirsh, UglyBarnacle, and FastMRI-AI, given the thickness overestimations seen from NYU-Knee AI. The top three submissions saw minimal bias and strong fidelity to ground truth, while NYU-Knee AI appeared to slightly overestimate particularly tibial and femoral cartilage thicknesses. That said, correlation plots showed strong correlations between predicted and ground truth thicknesses for K-nirsh, UglyBarnacle, and NYU-Knee AI. FastMRI-AI visually appeared to have strong correlation as well, but an outlier case appears to have severely degraded the correlation coefficient. All told, these results collectively are quite promising that submissions are suitable for some downstream biomarker analysis.
Figure 11
Figure 11
Femoral bone shape features, visualized after statistical parametrization, with qualitative descriptions of shape features. Similar features were also generated for the tibia and patella by the same procedure: extracting Euclidean points of bone surfaces, converting them into 1D vectors, using PCA to compress the resulting matrix into a 5-dimensional one, and visualizing each of the PCs.
Figure 12
Figure 12
Correlations along femoral, tibial, and patellar bone shape features between submissions and ground truth. For many of the bone shape features, correlations were moderate to strong, indicating another means in which submitted segmentations from 8× undersampled images at times were suitable for downstream biomarker analysis. K-nirsh and NYU-Knee AI appeared to have strong correlations most consistently between predicted and ground truth bone shapes among the top 4 submissions.

References

    1. Dean Deyle G. The Role of MRI in Musculoskeletal Practice: A Clinical Perspective. J. Man. Manip. Ther. 2011;19:152–161. doi: 10.1179/2042618611Y.0000000009. - DOI - PMC - PubMed
    1. del Grande F., Guggenberger R., Fritz J. Rapid Musculoskeletal MRI in 2021: Value and Optimized Use of Widely Accessible Techniques. AJR. 2021;216:704–717. doi: 10.2214/AJR.20.22901. - DOI - PubMed
    1. Delfaut E.M., Beltran J., Johnson G., Rousseau J., Marchandise X., Cotten A. Fat Suppression in MR Imaging: Techniques and Pitfalls. RadioGraphics. 1999;19:373–382. doi: 10.1148/radiographics.19.2.g99mr03373. - DOI - PubMed
    1. Bley T.A., Wieben O., François C.J., Brittain J.H., Reeder S.B. Fat and Water Magnetic Resonance Imaging. J. Magn. Res. Imaging. 2010;31:4–18. doi: 10.1002/jmri.21895. - DOI - PubMed
    1. Aydıngöz Ü., Yıldız A.E., Ergen F.B. Zero Echo Time Musculoskeletal MRI: Technique, Optimization, Applications, and Pitfalls. RadioGraphics. 2022;42:1398–1414. doi: 10.1148/rg.220029. - DOI - PubMed